Fig. 3.
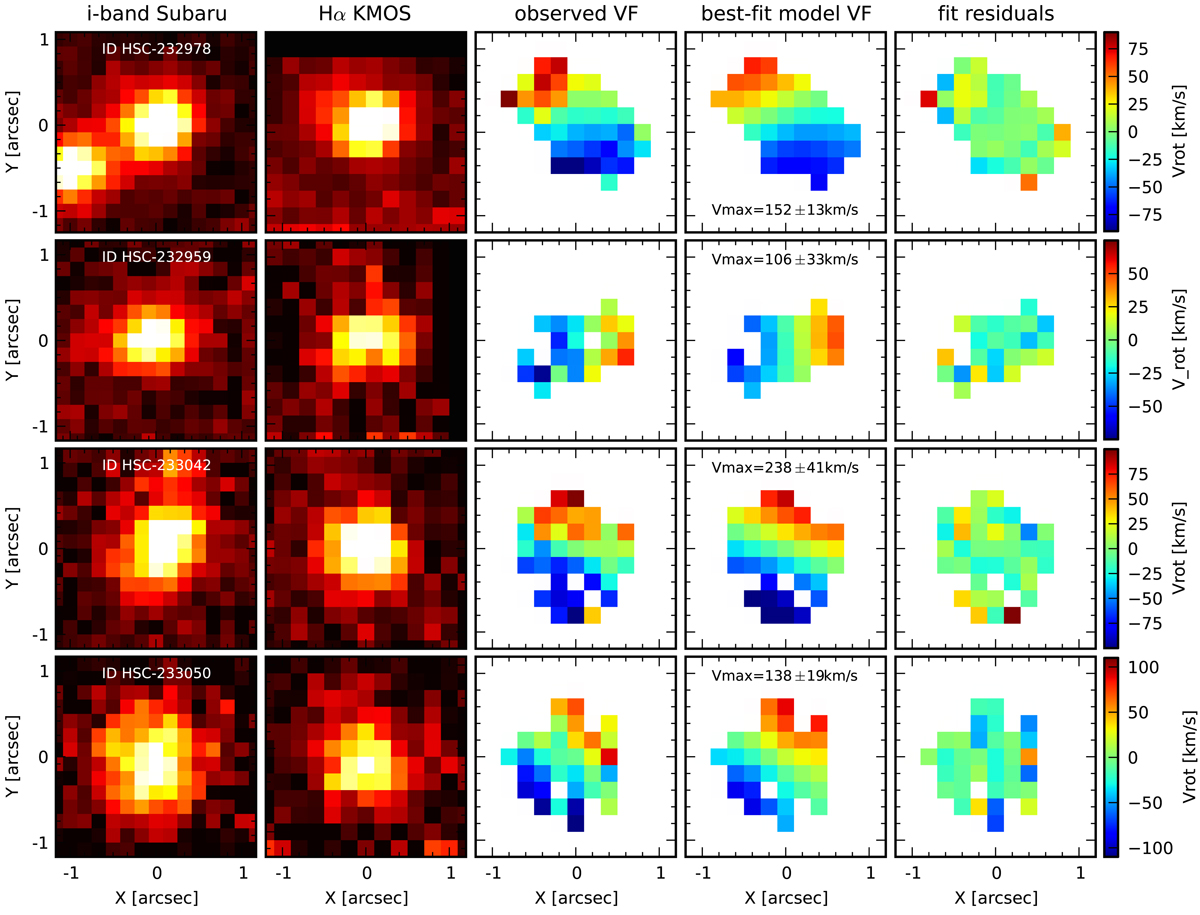
Four examples of z ≈ 1.47 (proto-)cluster galaxies for which the maximum rotation velocity Vmax could be determined. In each row, the plots show from left to right: best-seeing i-band image from the Subaru HSC survey, ionized gas map as observed in Hα with VLT/KMOS, observed rotation velocity field, best-fit model rotation velocity field used for the determination of the intrinsic Vmax, and fit residuals after subtracting the best-fit model from the observed velocity field. We note that the galaxy to the southeast of HSC-232978 (top panel, leftmost figure) is a foreground galaxy with a photometric redshift in the range 0.7 < zphot < 0.8, depending on the method, and undetected in the KMOS data.
Current usage metrics show cumulative count of Article Views (full-text article views including HTML views, PDF and ePub downloads, according to the available data) and Abstracts Views on Vision4Press platform.
Data correspond to usage on the plateform after 2015. The current usage metrics is available 48-96 hours after online publication and is updated daily on week days.
Initial download of the metrics may take a while.