Fig. C.1.
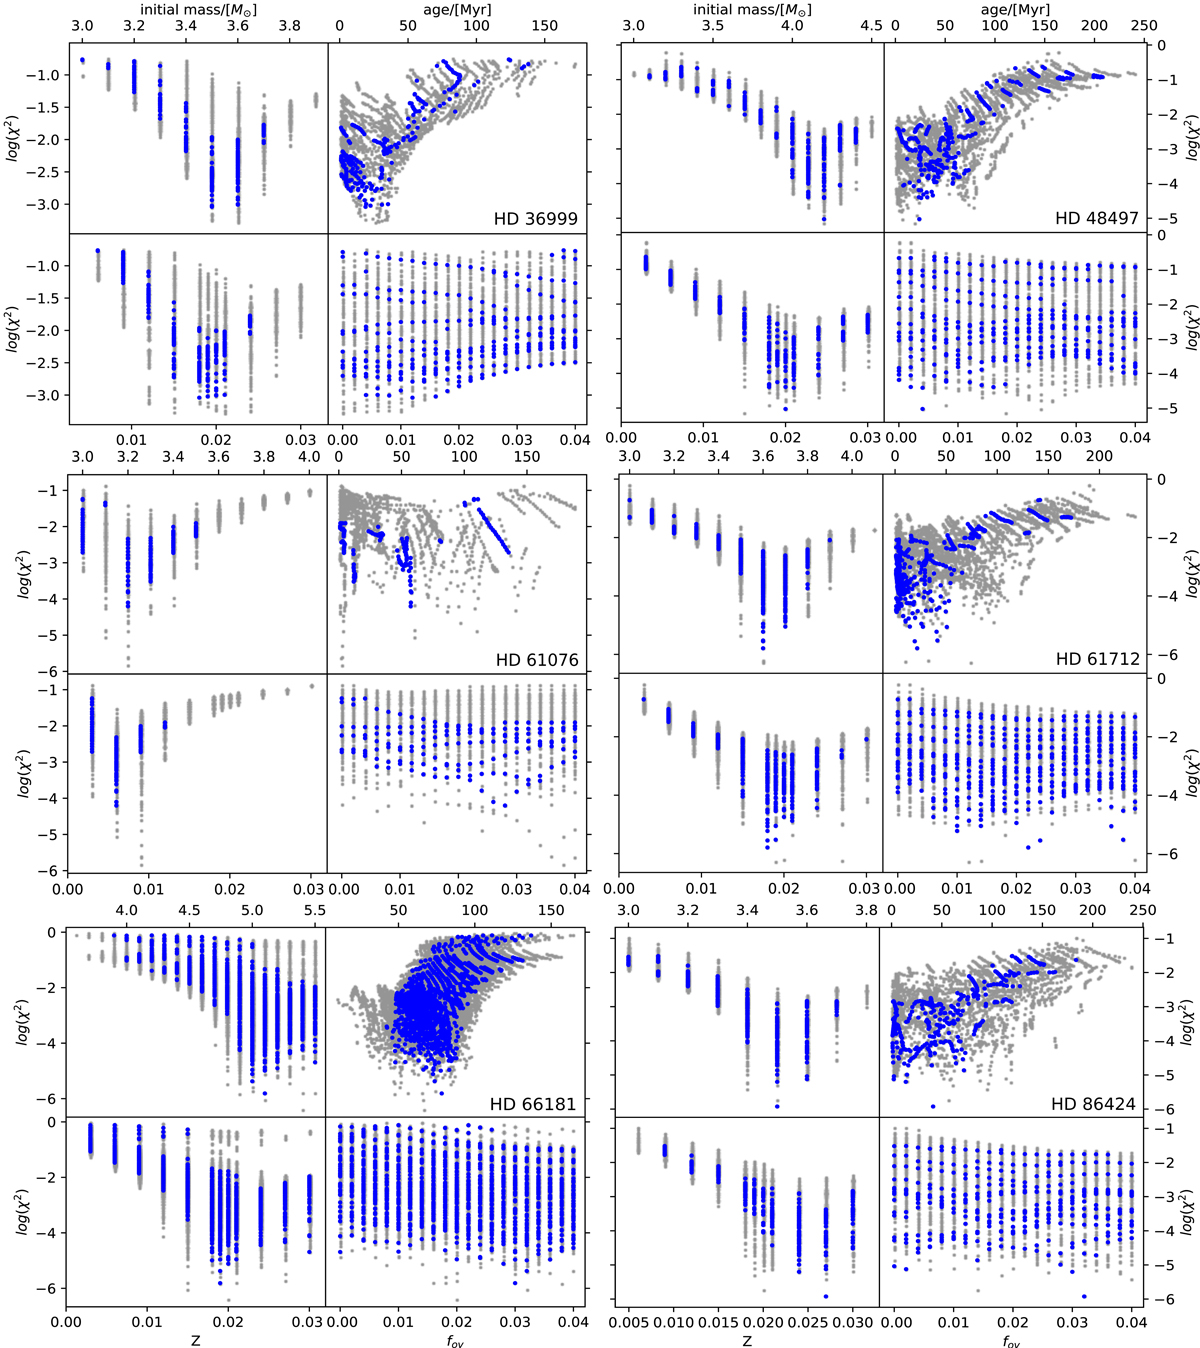
χ2 values of stellar models within 1σ (blue points) and 3σ (gray points) of the given target. Represented χ2 values were calculated for the best-fit g-mode combination as listed in Table 2. Each figure shows the χ2 distribution across all free parameters of the stellar model grid, i.e., initial mass (top left), age (top right), metallicity (bottom left), and overshooting (bottom right).
Current usage metrics show cumulative count of Article Views (full-text article views including HTML views, PDF and ePub downloads, according to the available data) and Abstracts Views on Vision4Press platform.
Data correspond to usage on the plateform after 2015. The current usage metrics is available 48-96 hours after online publication and is updated daily on week days.
Initial download of the metrics may take a while.