Fig. 3.
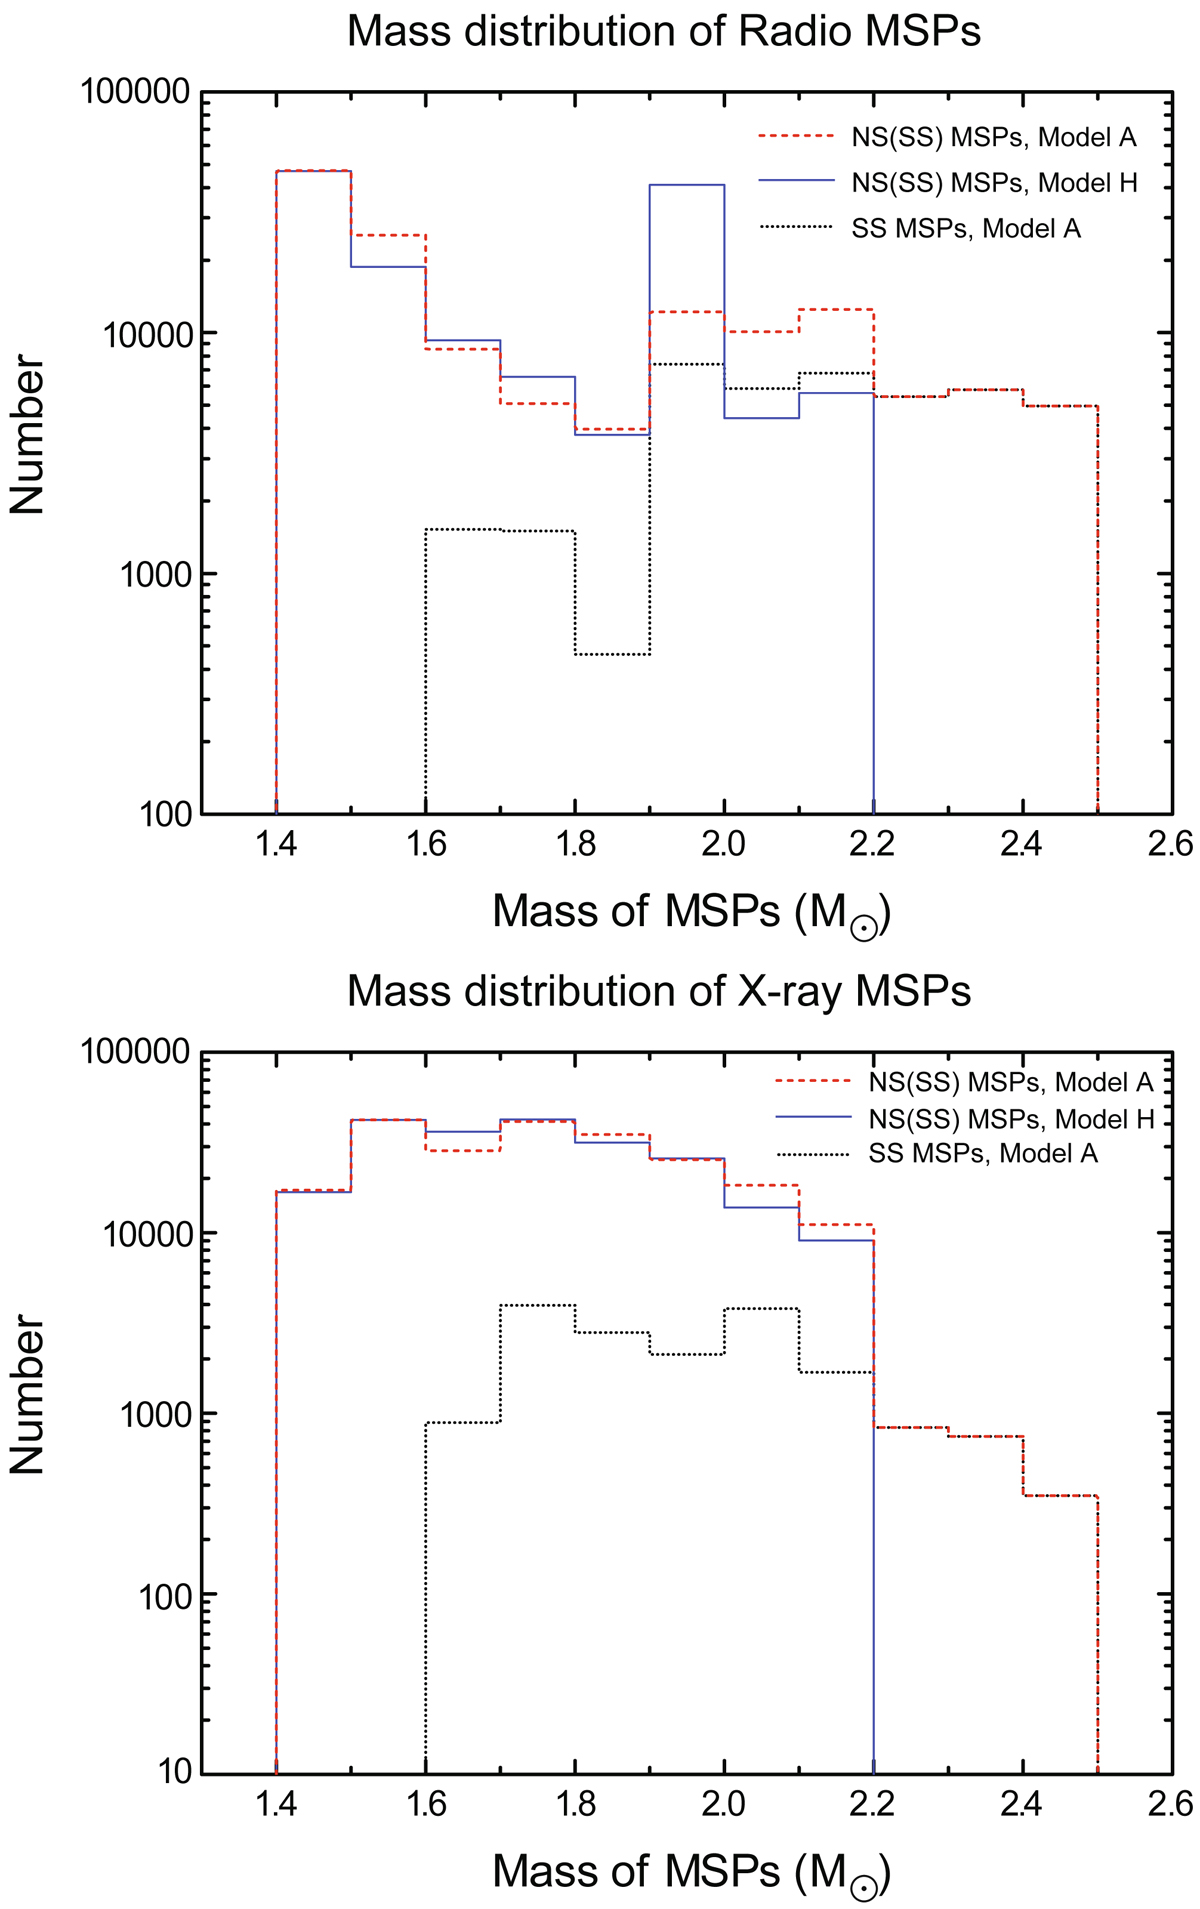
Mass distribution of radio (top panel) and X-ray (bottom panel) MSPs in our simulated binaries in the Galaxy. The red dashed lines and black dashed lines represent the number of all binary MSPs (including NS and SS MSPs) predicted by Model A and H (twin of A, see Sect. 4.3, for detail), respectively. The dotted lines correspond to SS MSPs predicted by Model A.
Current usage metrics show cumulative count of Article Views (full-text article views including HTML views, PDF and ePub downloads, according to the available data) and Abstracts Views on Vision4Press platform.
Data correspond to usage on the plateform after 2015. The current usage metrics is available 48-96 hours after online publication and is updated daily on week days.
Initial download of the metrics may take a while.