Fig. 8
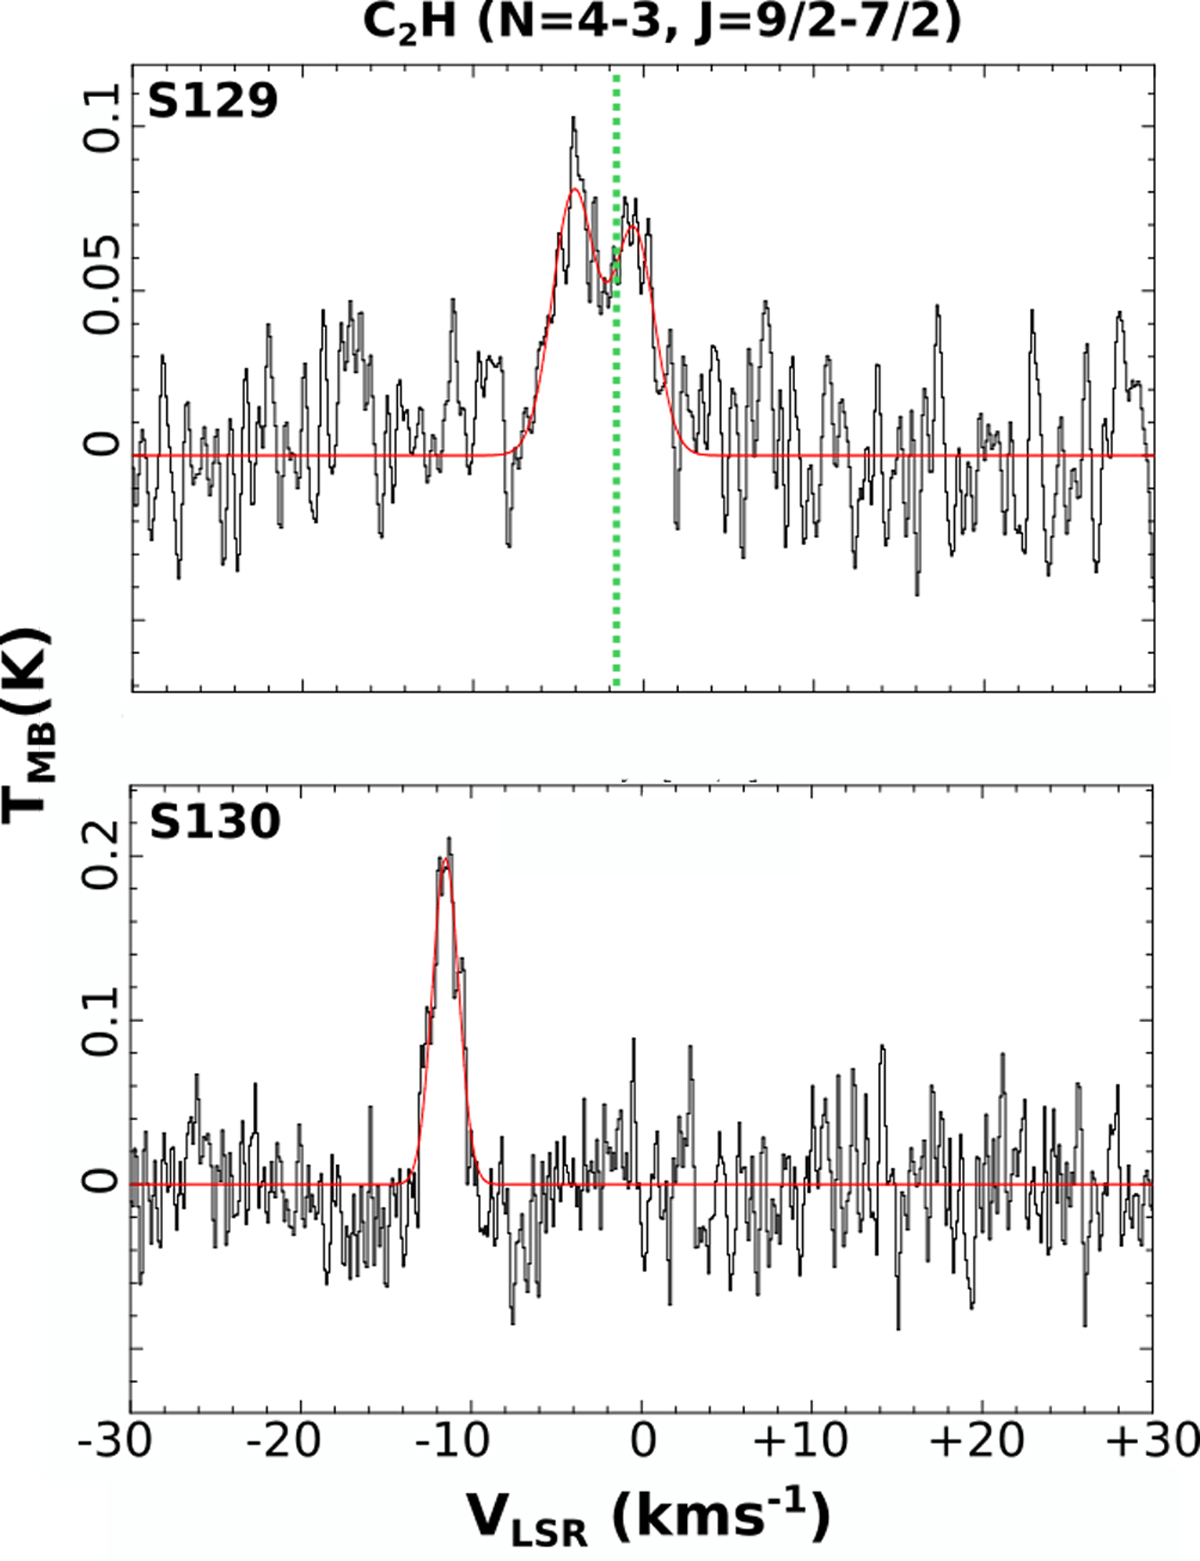
C2H N = 4−3 J = 9/2–7/2 spectra toward S129 (upper panel) and S130 (lower panel). The spectra were obtained toward the positions of the green crosses shown in Fig. 2. The red curves correspond to Gaussian fittings. The derived parameters are shown in Table 4. The dashed vertical green line indicates the RV for the H2 1−0 S(1) line related to S129 found by Lim et al. (2018).
Current usage metrics show cumulative count of Article Views (full-text article views including HTML views, PDF and ePub downloads, according to the available data) and Abstracts Views on Vision4Press platform.
Data correspond to usage on the plateform after 2015. The current usage metrics is available 48-96 hours after online publication and is updated daily on week days.
Initial download of the metrics may take a while.