Fig. 4
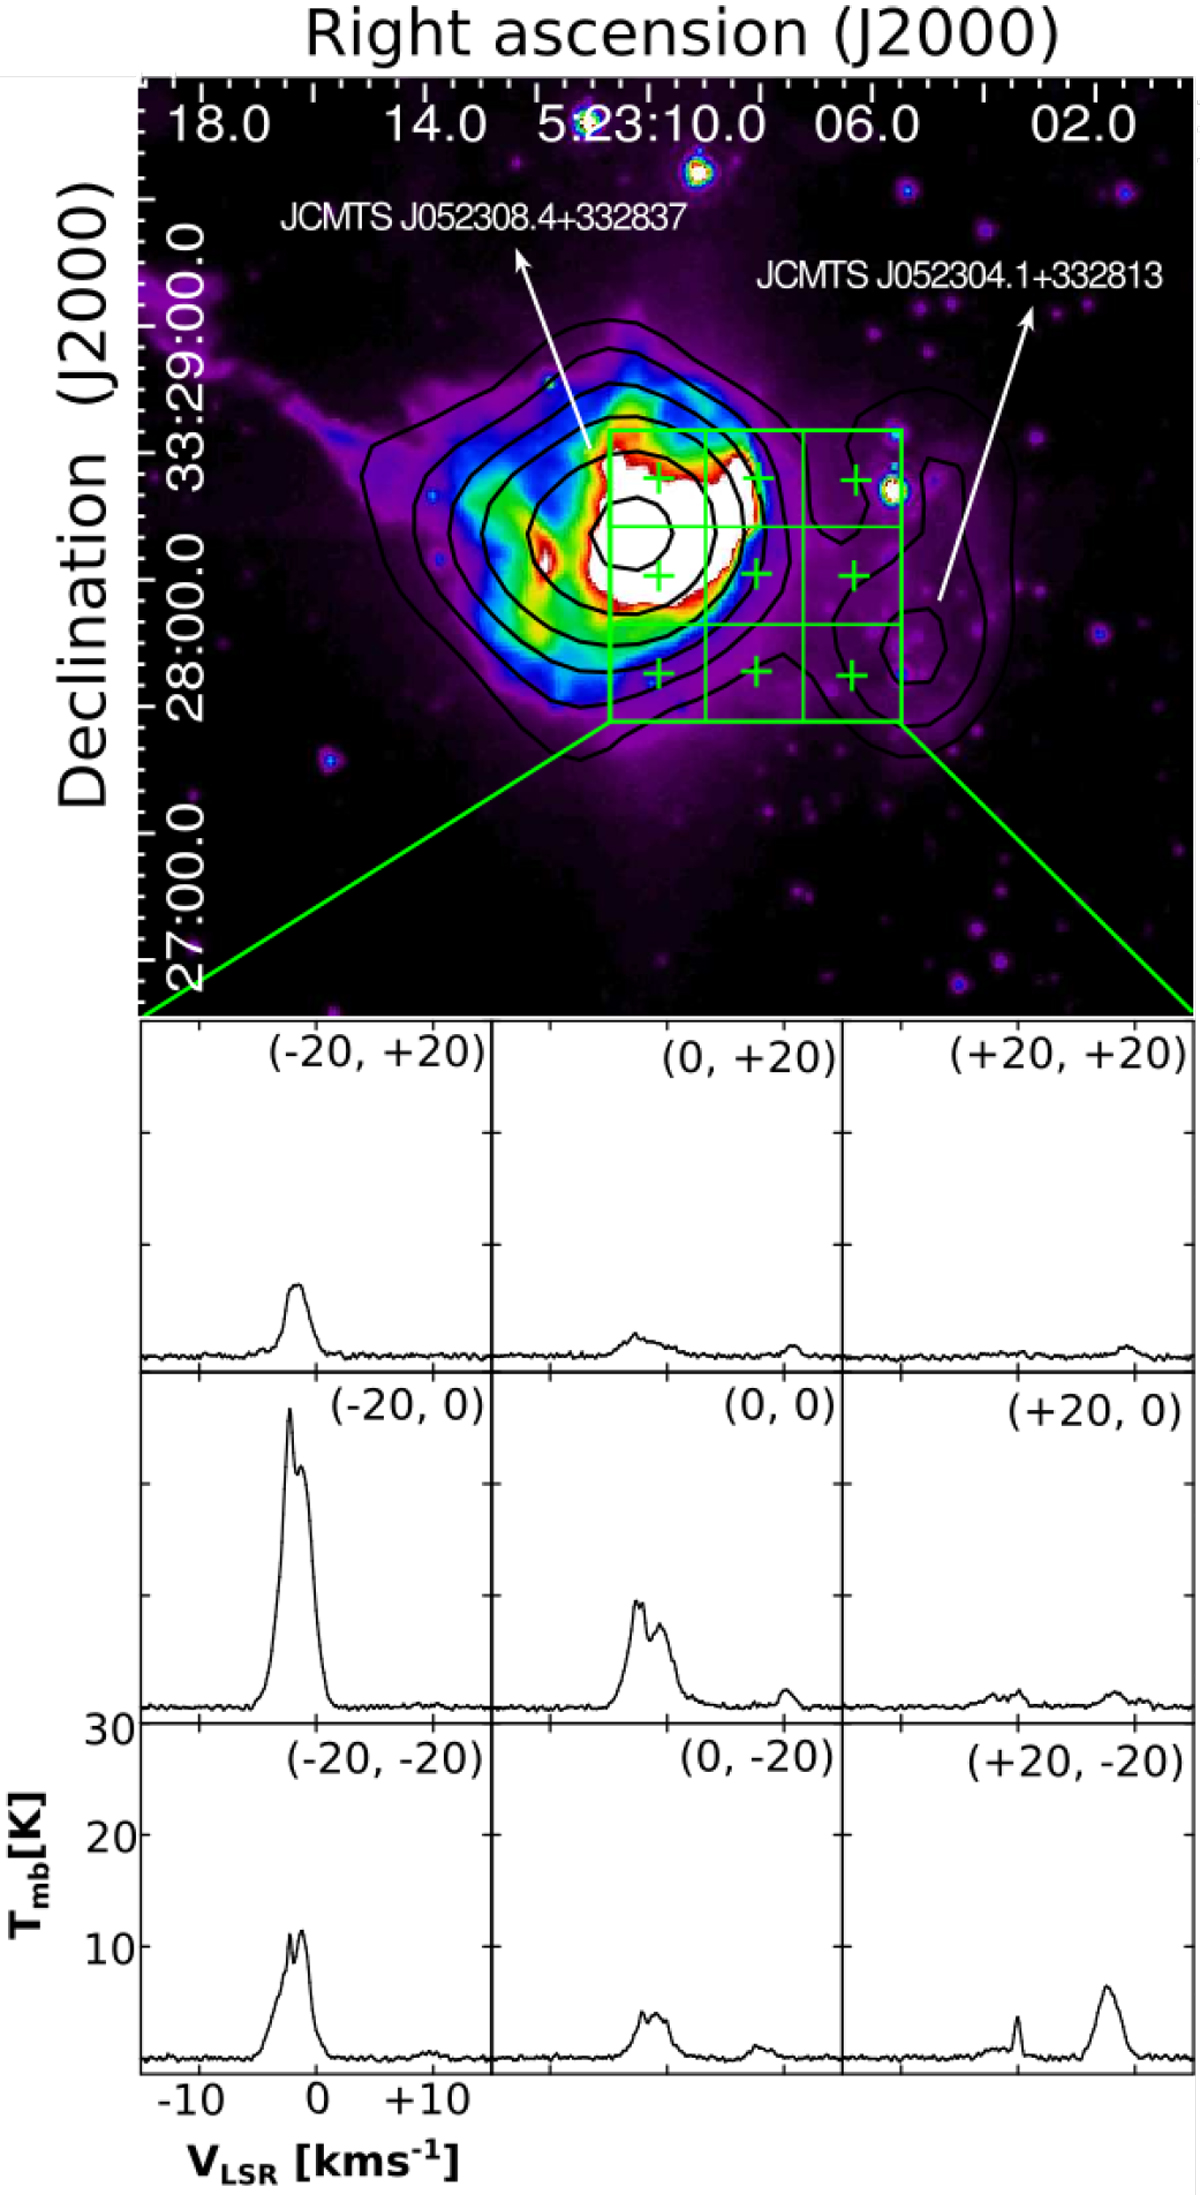
12CO J = 3−2 spectra toward the region of S129. The region where the spectra were taken is shown superimposed on the Spitzer-IRAC 5.8 μm emission. The color scale goes from 10 MJy sr−1 (violet) to 60 MJy sr−1 (white). The black contours represent the submillimeter continuum emission at 850 μm as extracted from the SCUBA survey. The levels are at 40, 70, 100, 120, 180, and 250 mJy beam−1.
Current usage metrics show cumulative count of Article Views (full-text article views including HTML views, PDF and ePub downloads, according to the available data) and Abstracts Views on Vision4Press platform.
Data correspond to usage on the plateform after 2015. The current usage metrics is available 48-96 hours after online publication and is updated daily on week days.
Initial download of the metrics may take a while.