Fig. 3
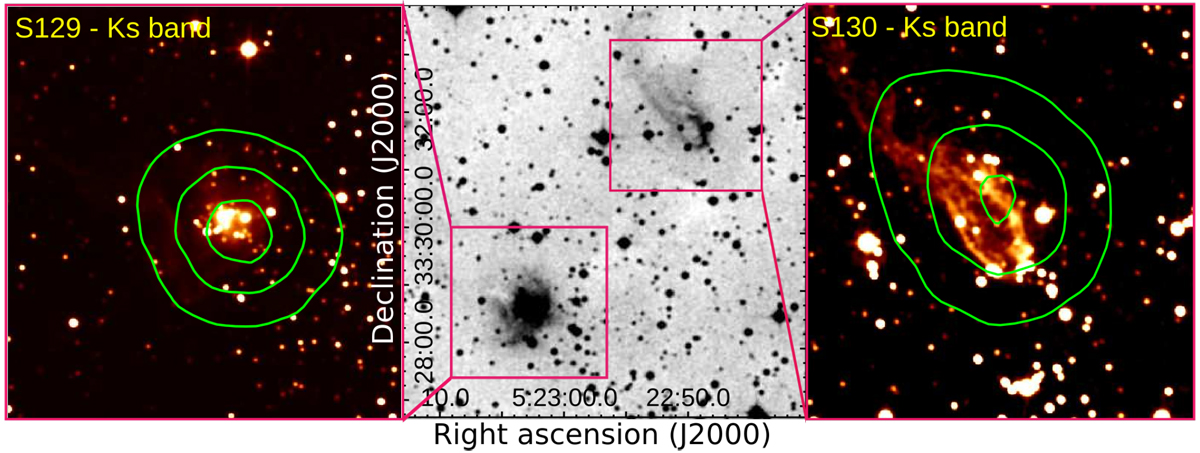
Central panel: optical emission extracted from the Digital Sky Survey 2 (DSS2) toward S129 and S130. Left-panel: zoom-up view of S129 at the UKIDSS Ks band. Right-panel: zoom-up view of S130 at the UKIDSS Ks band. Green contours represent the radio continuum emission at 1.4 GHz extracted from the NRAO VLA Sky Survey (NVSS; Condon et al. 1998). Levels are at 5, 10, and 15 mJy beam−1. Radio continuum shows the NVSS sources 052307+332832 and 052255+333156 related to S129 and S130, respectively.
Current usage metrics show cumulative count of Article Views (full-text article views including HTML views, PDF and ePub downloads, according to the available data) and Abstracts Views on Vision4Press platform.
Data correspond to usage on the plateform after 2015. The current usage metrics is available 48-96 hours after online publication and is updated daily on week days.
Initial download of the metrics may take a while.