Fig. 2
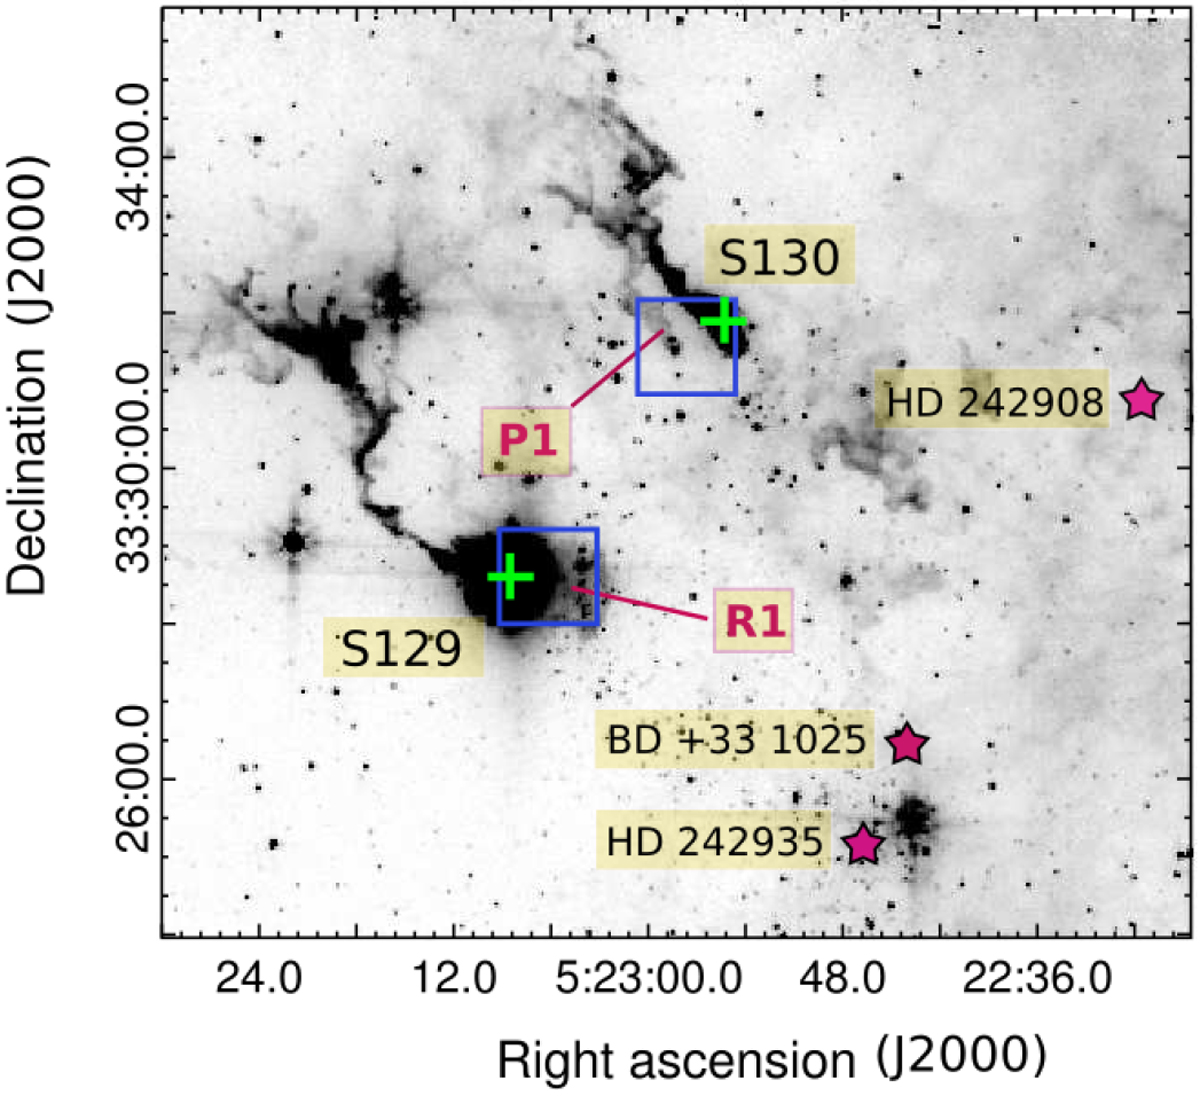
Spitzer-IRAC emission at 5.8 μm of S129 and S130. The grayscale goes from 3 to 9 MJy sr−1. P1 and R1 indicate the position of a pillar-like feature and a region of diffuse gas, respectively. The blue squares indicate the regions mapped in 12CO J = 3−2 and HCO+ J = 4−3 lines. The green crosses represent the location of the single pointings of the HCO+, HCN, HNC J = 4−3, and C2 H N = 4−3 J = 9/2–7/2 lines.
Current usage metrics show cumulative count of Article Views (full-text article views including HTML views, PDF and ePub downloads, according to the available data) and Abstracts Views on Vision4Press platform.
Data correspond to usage on the plateform after 2015. The current usage metrics is available 48-96 hours after online publication and is updated daily on week days.
Initial download of the metrics may take a while.