Fig. 1
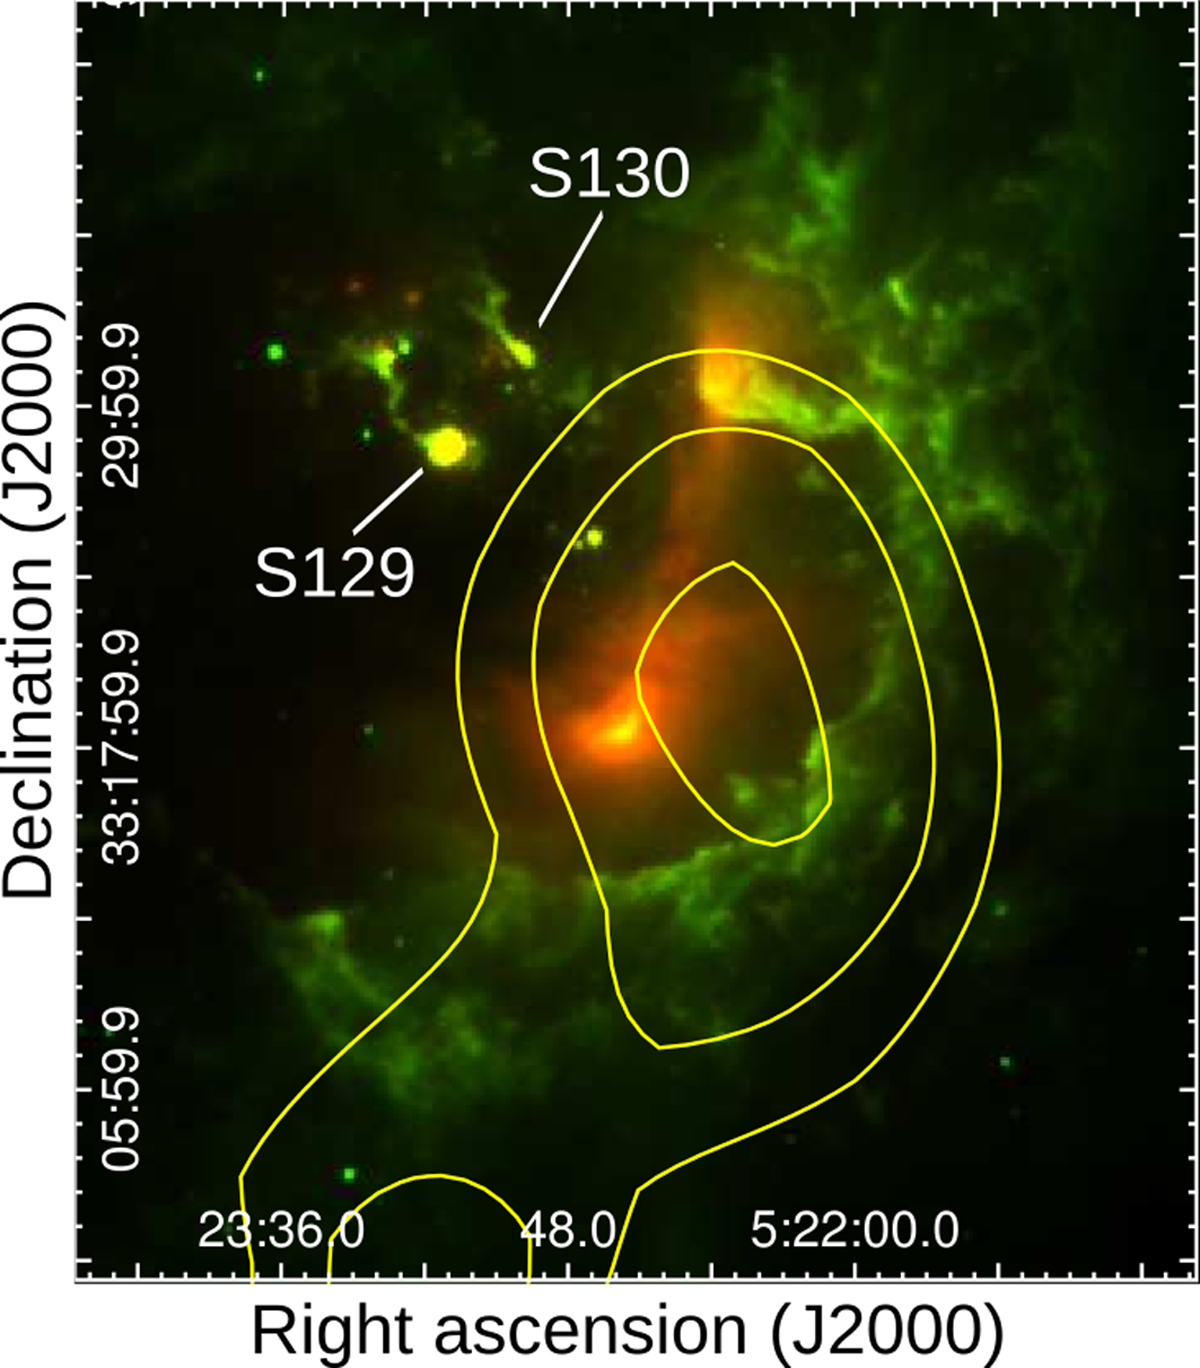
WISE two-color image of H II region Sh2-236 and the cometary globules S129 and S130 at 12 μm in green, and22 μm in red. The yellow contours represent the 12CO (1–0) emission (angular resolution about 3.75 arcmin) integrated between − 10 and + 10 km s−1 extracted from the CfA 1.2 m CO Survey Archive (Dame et al. 2001). Contour levels are at 3, 4, and 5 K km s−1. The systemic velocity of the CO emission is about −7 km s−1.
Current usage metrics show cumulative count of Article Views (full-text article views including HTML views, PDF and ePub downloads, according to the available data) and Abstracts Views on Vision4Press platform.
Data correspond to usage on the plateform after 2015. The current usage metrics is available 48-96 hours after online publication and is updated daily on week days.
Initial download of the metrics may take a while.