Fig. 6
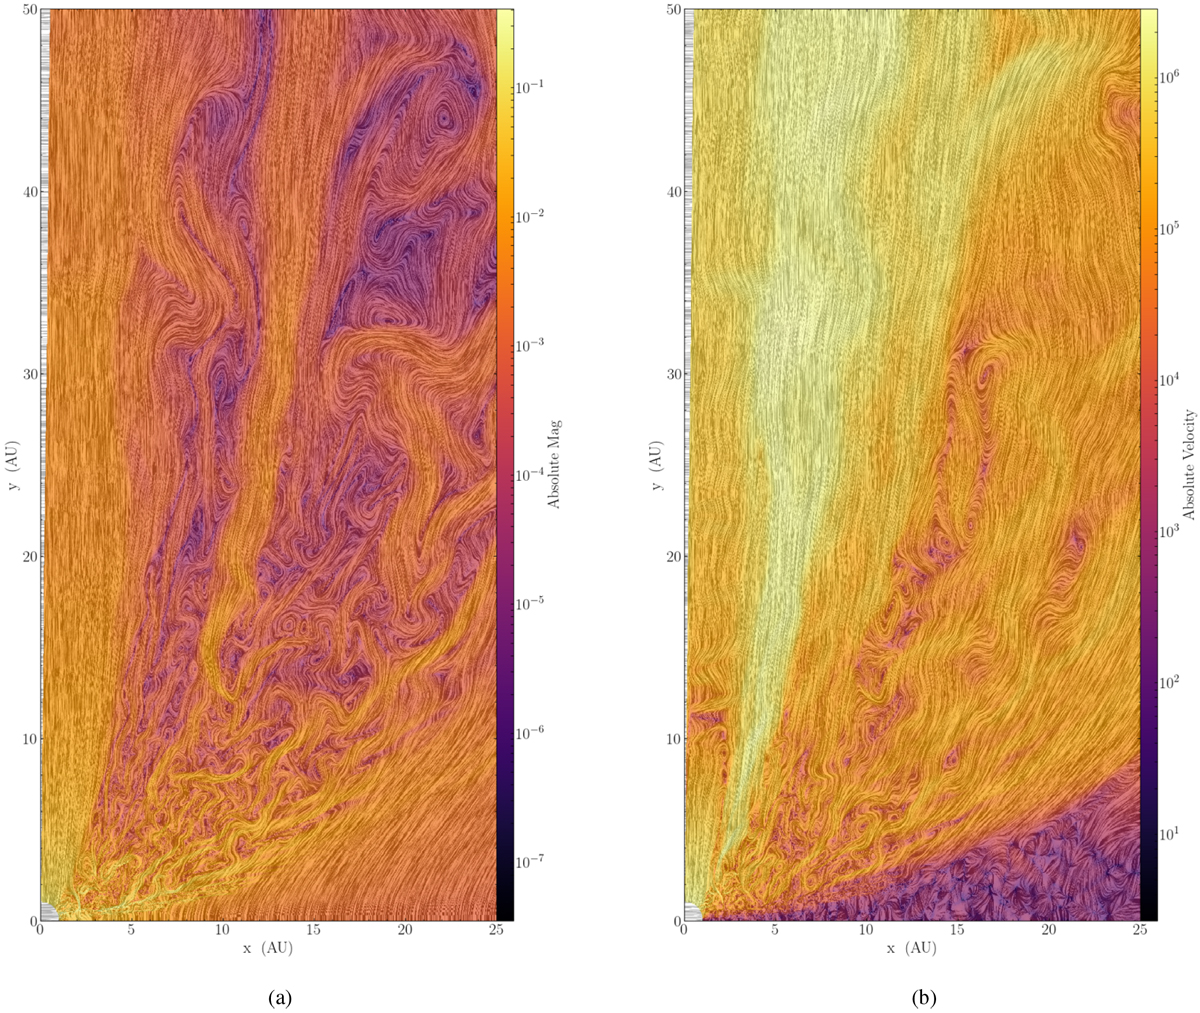
Left panel: magnetic field structure (LIC) is visualized for simulation X-b5 after 158 yr. Only the upper hemisphere (both are simulated) is shown to highlight a larger portion of the wind structure. The color map represents the absolute poloidal magnetic flux density in Gauss. Right panel: velocity profile is depicted, including the color as the absolute velocity in cgs units. The wind is not in a steady state, as the irregular magnetic field lines and stream lines indicate.
Current usage metrics show cumulative count of Article Views (full-text article views including HTML views, PDF and ePub downloads, according to the available data) and Abstracts Views on Vision4Press platform.
Data correspond to usage on the plateform after 2015. The current usage metrics is available 48-96 hours after online publication and is updated daily on week days.
Initial download of the metrics may take a while.