Fig. 5
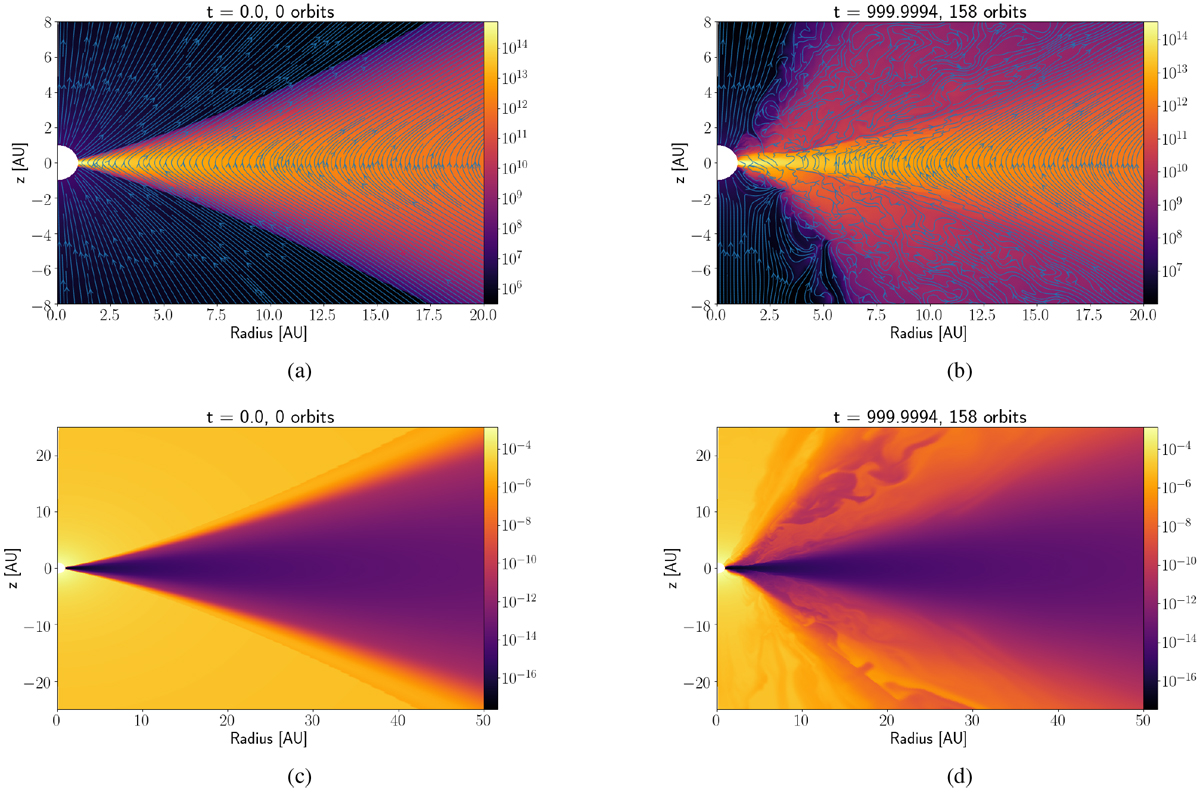
Panels a and b: number density in cm−3 and the magnetic field lines of simulation X-b5 in the initial configuration and after an evolution of 158 inner orbits at r = r0 (≈ 1.8 orbits at 20 au), where a strong wind emerges. A slightly asymmetric flow forms in the inner region. Panels c and d: ionization fraction xe in the disk. The snapshot after 158 orbits at r = r0 visualizes the reduced ionization fraction due to the thick wind flow.
Current usage metrics show cumulative count of Article Views (full-text article views including HTML views, PDF and ePub downloads, according to the available data) and Abstracts Views on Vision4Press platform.
Data correspond to usage on the plateform after 2015. The current usage metrics is available 48-96 hours after online publication and is updated daily on week days.
Initial download of the metrics may take a while.