Free Access
Fig. 4
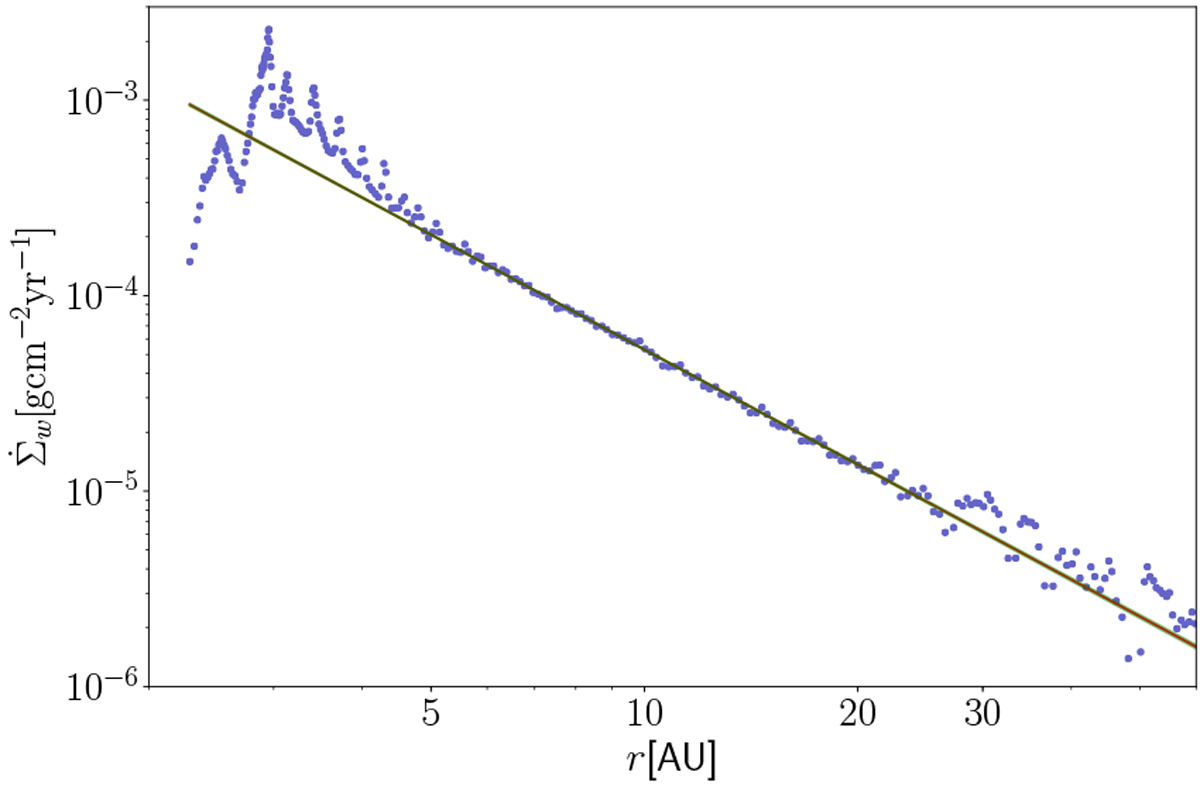
Column density loss in g cm−2 and years with a fitted power law. Within 5 au, the wind rate clearly diverges from the power law, which is also true in the region near the outer simulation boundary. The two green lines represent the one-sigma margin of the fit result.
Current usage metrics show cumulative count of Article Views (full-text article views including HTML views, PDF and ePub downloads, according to the available data) and Abstracts Views on Vision4Press platform.
Data correspond to usage on the plateform after 2015. The current usage metrics is available 48-96 hours after online publication and is updated daily on week days.
Initial download of the metrics may take a while.