Fig. 2
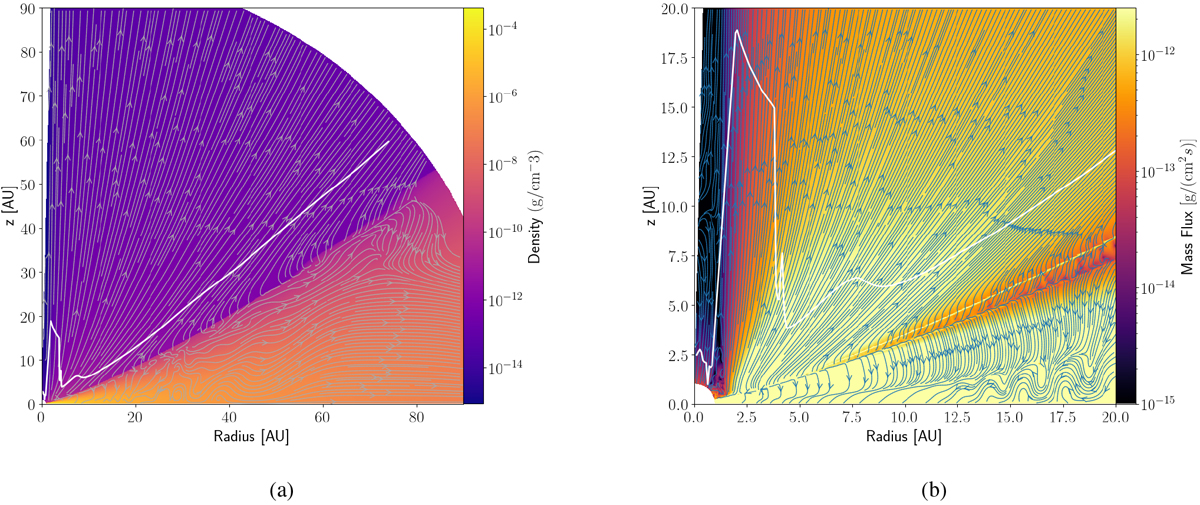
Both panels are based on the simulation X-bn-h, time averaged from 555 to 714 yr. The white line represents the sonic surface in the wind flow, and the blue field lines correspond to the velocity stream lines. Panel b: mass flux ρv2. Within ≈3 au, a significantly lower mass flux is visible. The photoevaporation simulations are only carried out for one hemisphere.
Current usage metrics show cumulative count of Article Views (full-text article views including HTML views, PDF and ePub downloads, according to the available data) and Abstracts Views on Vision4Press platform.
Data correspond to usage on the plateform after 2015. The current usage metrics is available 48-96 hours after online publication and is updated daily on week days.
Initial download of the metrics may take a while.