Fig. 16
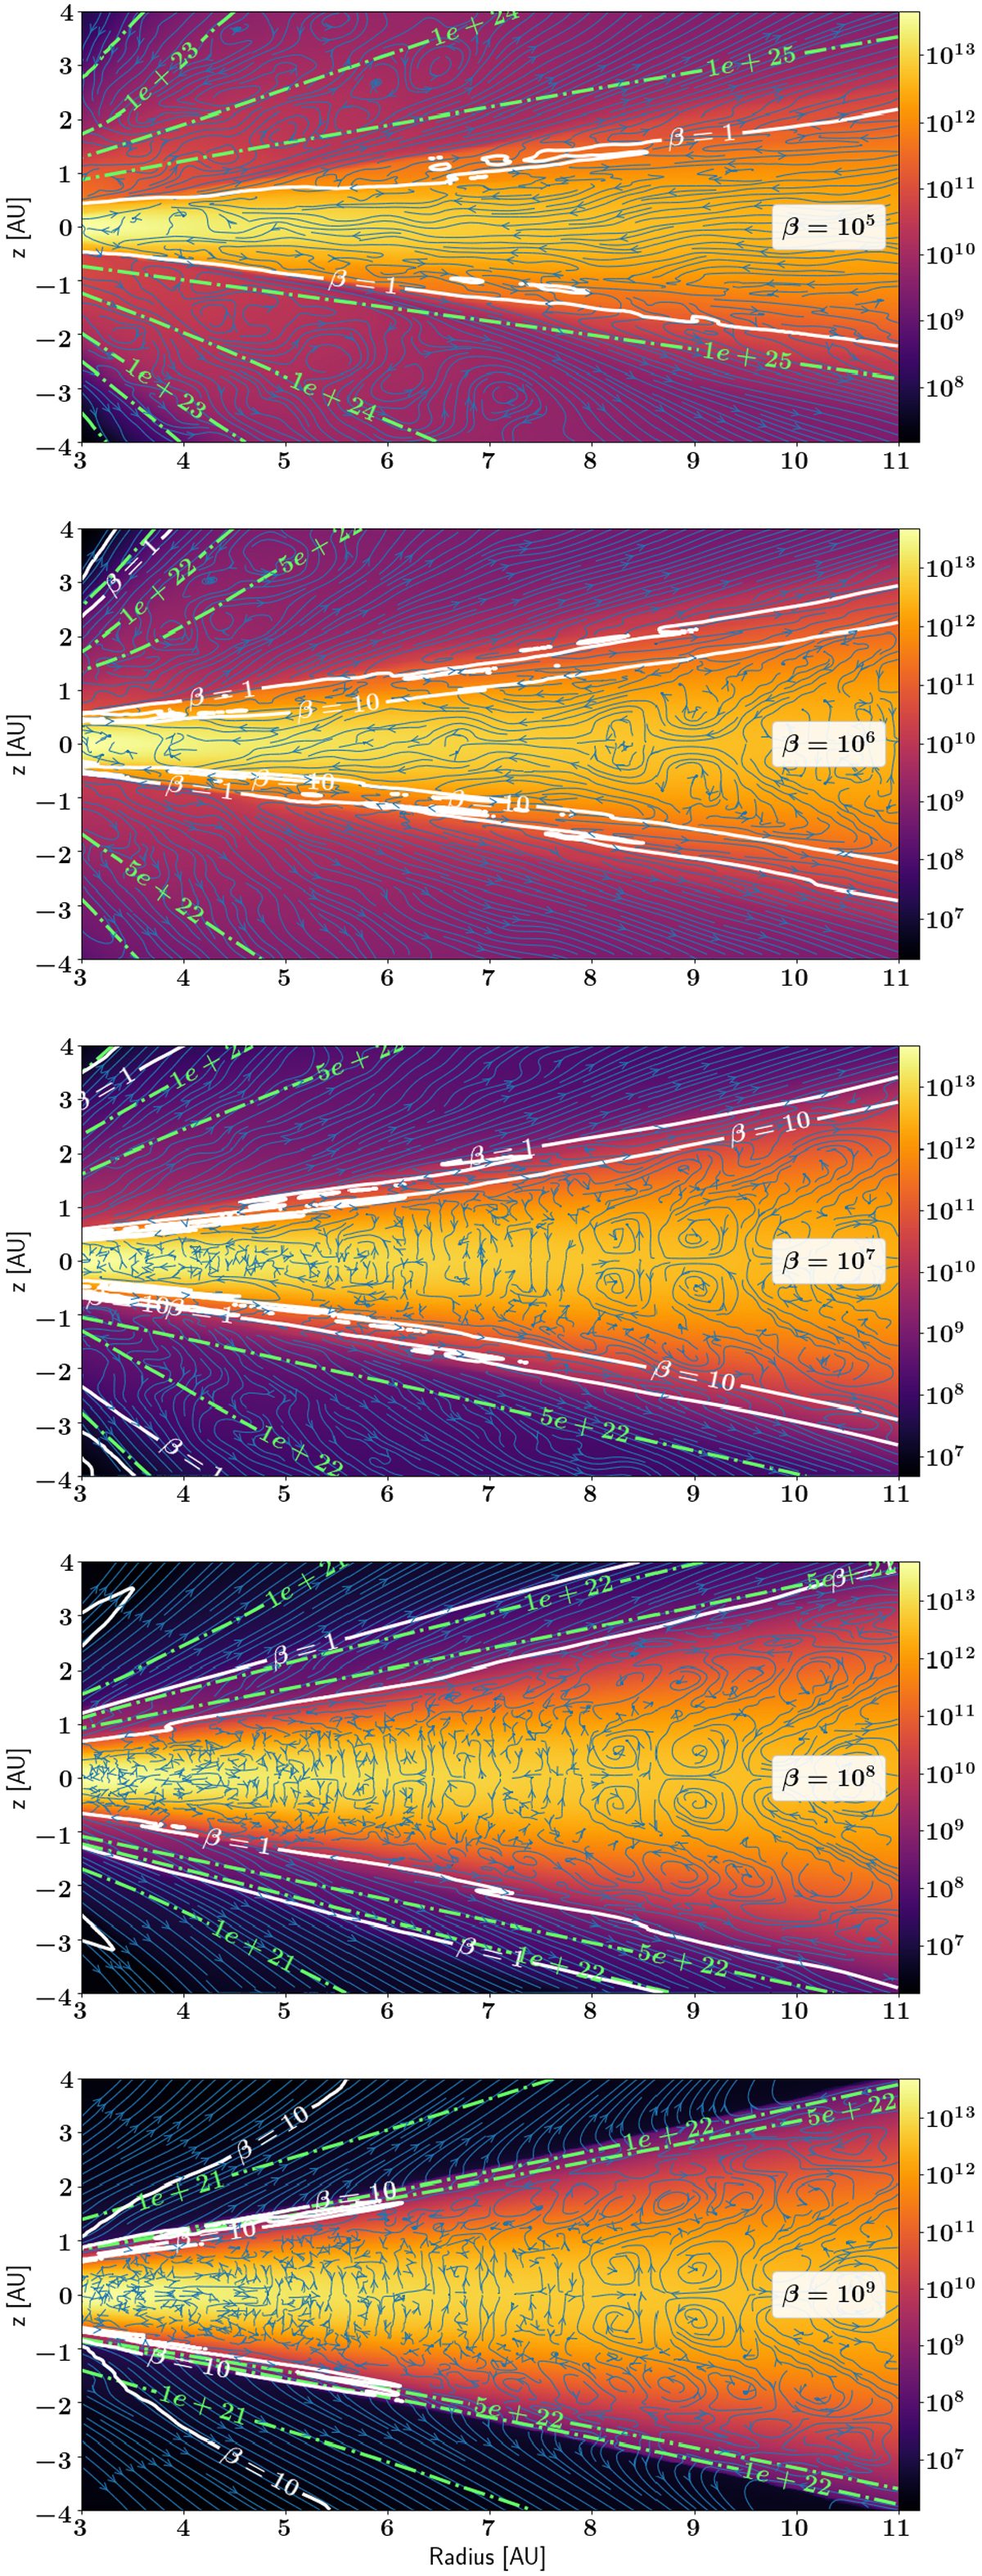
Time-averaged flows with varying initial values of β in the mid-plane. The green dash-dotted line represents the radial column density in cm−2. The white lines mark contours of the local plasma beta. In all plots the blue arrowed lines trace velocity stream lines of the flow. The color map indicates the number density of the gas.
Current usage metrics show cumulative count of Article Views (full-text article views including HTML views, PDF and ePub downloads, according to the available data) and Abstracts Views on Vision4Press platform.
Data correspond to usage on the plateform after 2015. The current usage metrics is available 48-96 hours after online publication and is updated daily on week days.
Initial download of the metrics may take a while.