Fig. 8.
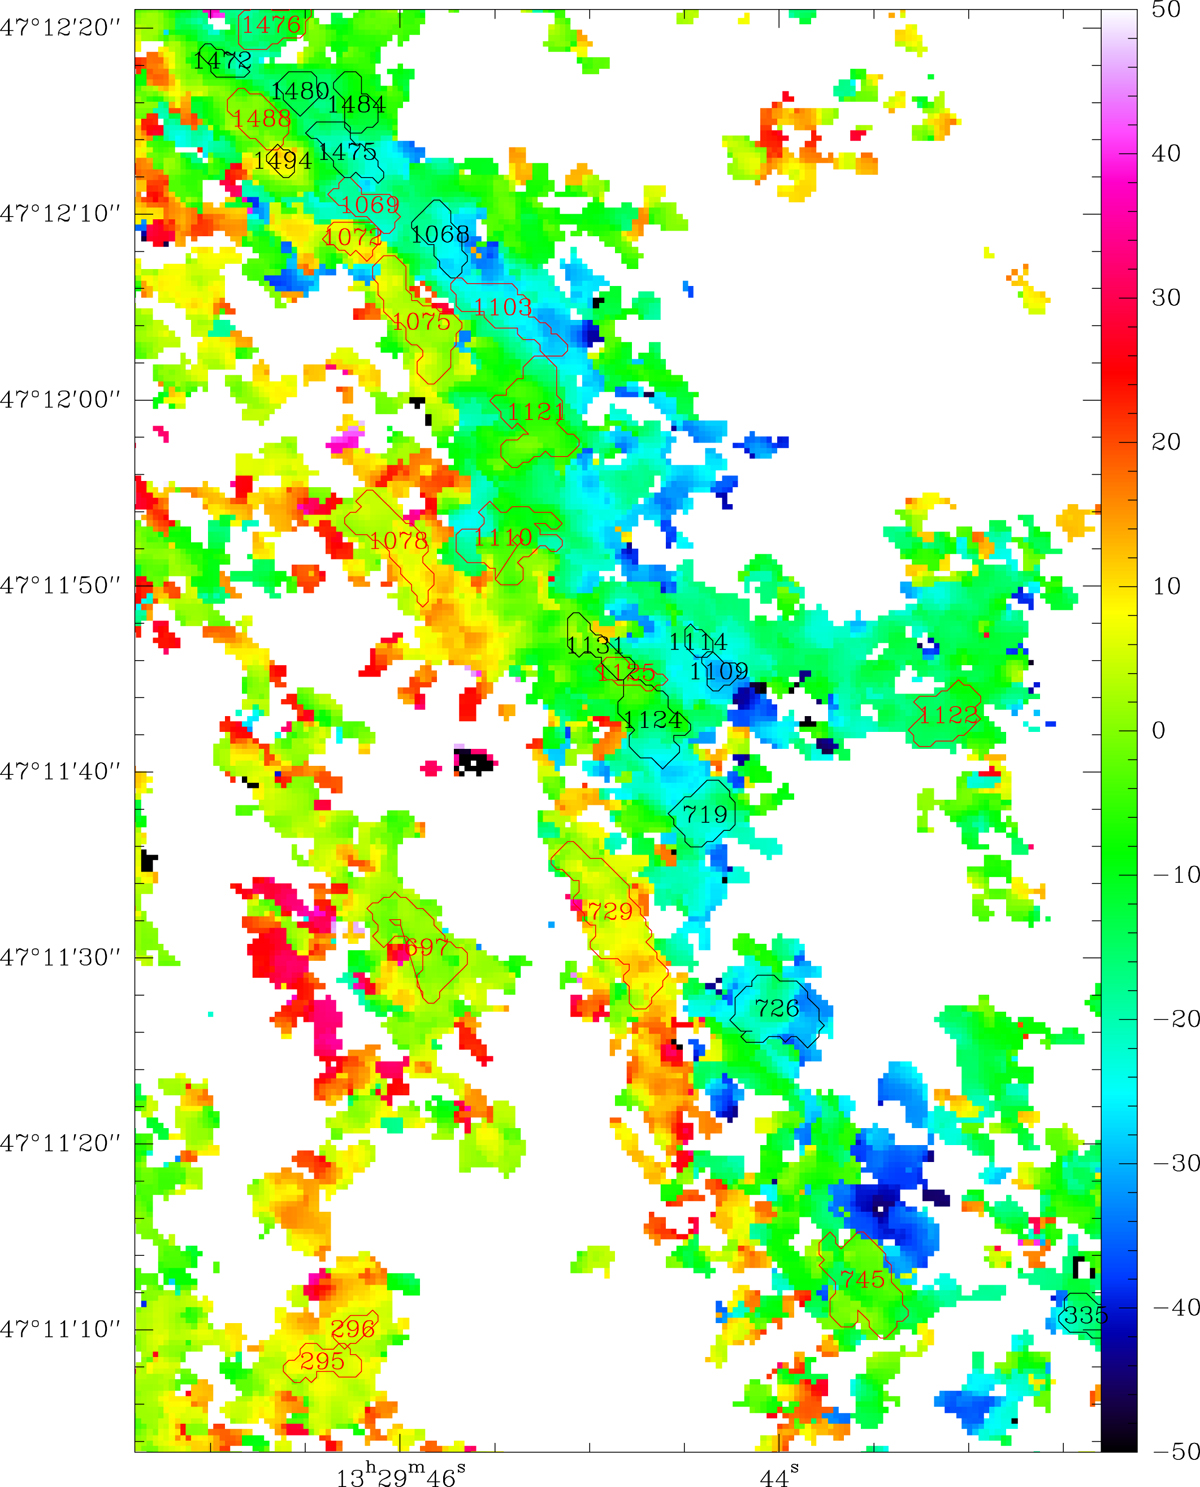
Residual velocity field as before but only for Arm 1. Printed in red and black are respectively the prograde and retrograde rotators from the S/N ≥ 10 sample. The contours give the cloud sizes and shapes. As can be seen, most clouds enter the arm (redshifted side for Arm 1) as prograde rotators and come out as retrograde rotators. The same is seen in Arm 2 and in the lower S/N sample (see last part of Table 2) but there are too many clouds for a simple visualization.
Current usage metrics show cumulative count of Article Views (full-text article views including HTML views, PDF and ePub downloads, according to the available data) and Abstracts Views on Vision4Press platform.
Data correspond to usage on the plateform after 2015. The current usage metrics is available 48-96 hours after online publication and is updated daily on week days.
Initial download of the metrics may take a while.