Fig. 6.
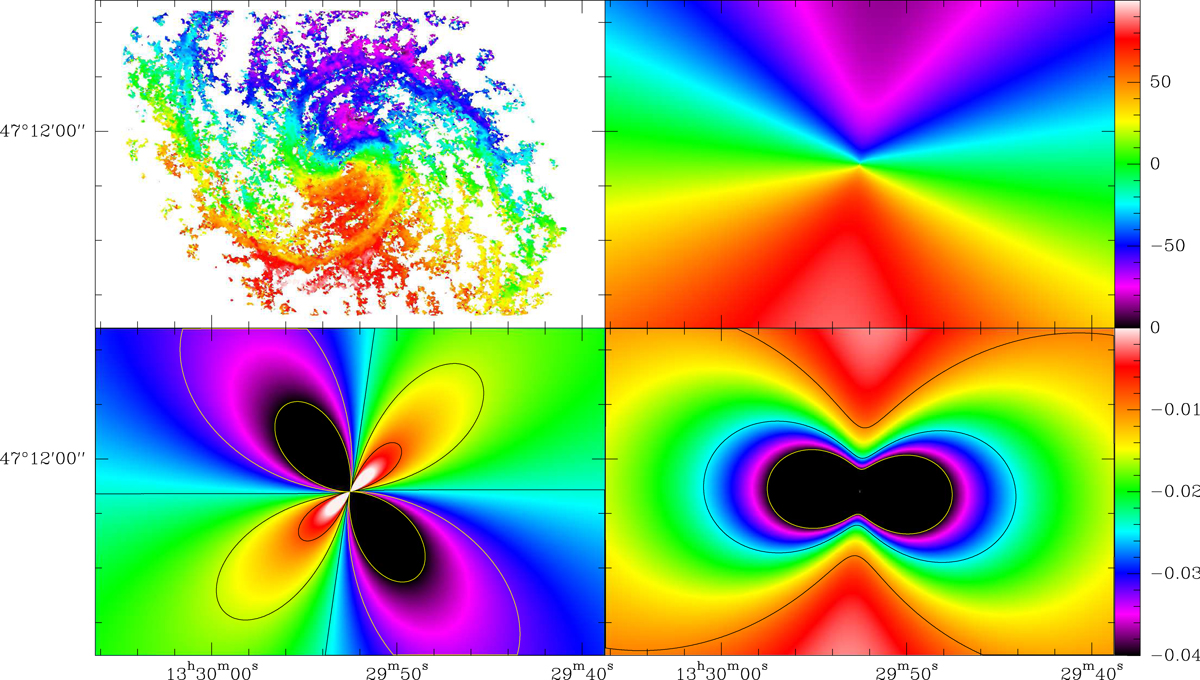
First panel: PAWS first moment (velocity) from the CO(1–0) observations by Schinnerer et al. (2013) and upper right panel: analytical velocity field designed to approximate the observations but with purely circular rotation and a constant position angle and inclination. Lower panels: (left) velocity gradient ![]() and (right)
and (right) ![]() due to rotation. Contours are at −20, −10, 0, 10, and 20 m s−1 pc−1 for
due to rotation. Contours are at −20, −10, 0, 10, and 20 m s−1 pc−1 for ![]() and at −10, −25, and −40 (yellow) m s−1 pc−1 for
and at −10, −25, and −40 (yellow) m s−1 pc−1 for ![]() . The color bars show (top) the velocity and (bottom) the velocity gradient for
. The color bars show (top) the velocity and (bottom) the velocity gradient for ![]() . For
. For ![]() (lower left panel), the straight lines are the 0 m s−1 pc−1 contour which defines the regions discussed in Sect. 3. All velocity gradients are measured in the sky plane (RA–Dec). A more complete explanation of this type of figure can be found in Sect. 5.1 of B18.
(lower left panel), the straight lines are the 0 m s−1 pc−1 contour which defines the regions discussed in Sect. 3. All velocity gradients are measured in the sky plane (RA–Dec). A more complete explanation of this type of figure can be found in Sect. 5.1 of B18.
Current usage metrics show cumulative count of Article Views (full-text article views including HTML views, PDF and ePub downloads, according to the available data) and Abstracts Views on Vision4Press platform.
Data correspond to usage on the plateform after 2015. The current usage metrics is available 48-96 hours after online publication and is updated daily on week days.
Initial download of the metrics may take a while.