Fig. 5.
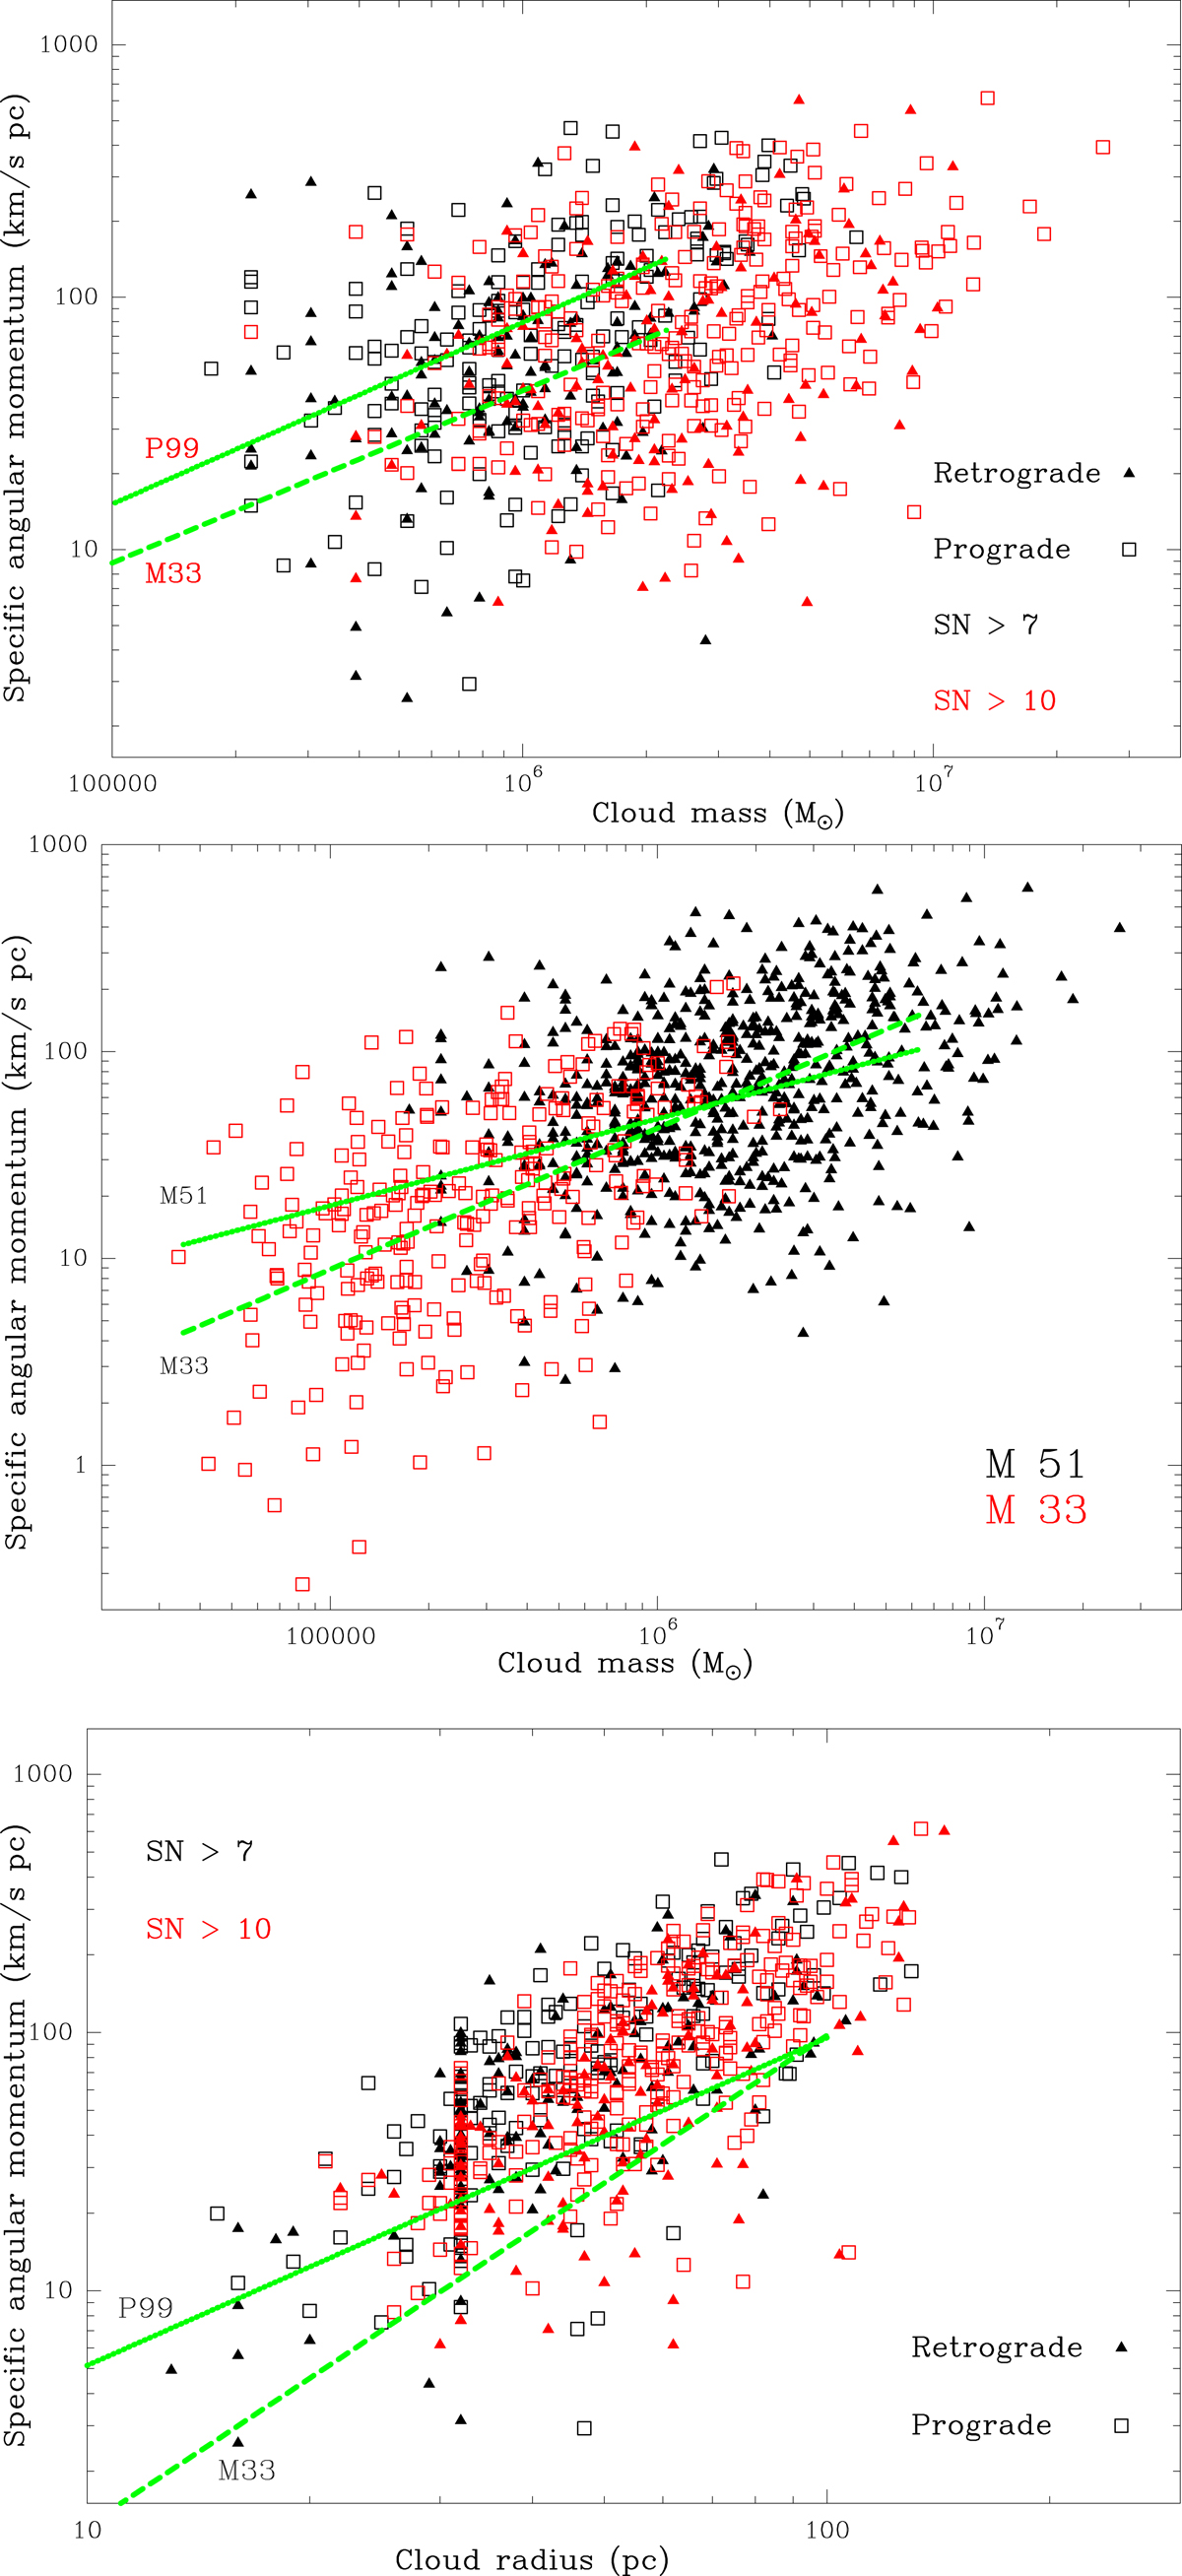
Top: specific angular momentum as a function of cloud mass. The trends from B18 for M 33 and from Phillips (1999) are indicated. This figure can be directly compared with B18 and with Dobbs (2008). Middle: here we show the strong M 33 clouds along with the M 51 clouds, without showing the distinctions between pro/retrograde and S/N level. While the values are lower for the M 33 clouds, the M 51 clouds follow a similar trend. Bottom: specific angular momentum as a function of cloud radius. The trend from Phillips (1999) is indicated. The cloud radii are from Colombo et al. (2014a) and the accumulation at 32 pc is due to a limit set by Colombo et al. (2014a). The fit results for M 33 and M 51 for both the high S/N and full samples are given in Table 1. The scatter about the fits is a factor 2–3 (precise values given in Table 1).
Current usage metrics show cumulative count of Article Views (full-text article views including HTML views, PDF and ePub downloads, according to the available data) and Abstracts Views on Vision4Press platform.
Data correspond to usage on the plateform after 2015. The current usage metrics is available 48-96 hours after online publication and is updated daily on week days.
Initial download of the metrics may take a while.