Fig. 4.
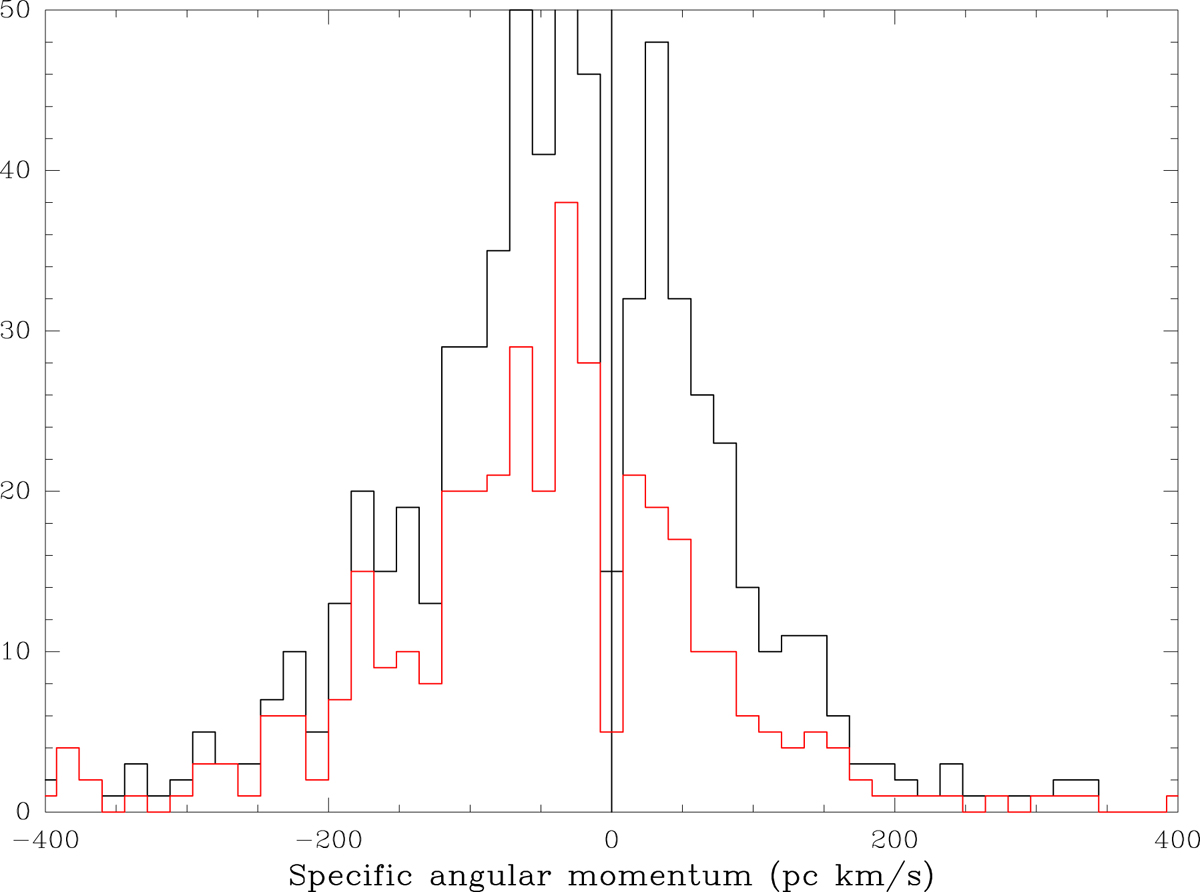
Histogram of angular momenta for M 51 clouds. In black for the subsample S/N ≥ 7 and in red for the subsample S/N ≥ 10. Note that the gradients in the higher S/N subsample are better defined (more prograde and with a more significant gradient). We have included a correction for beam-smearing as in B18. The angular momenta of the M 51 clouds are substantially higher than in M 33 (see middle panel of next figure).
Current usage metrics show cumulative count of Article Views (full-text article views including HTML views, PDF and ePub downloads, according to the available data) and Abstracts Views on Vision4Press platform.
Data correspond to usage on the plateform after 2015. The current usage metrics is available 48-96 hours after online publication and is updated daily on week days.
Initial download of the metrics may take a while.