Fig. 3.
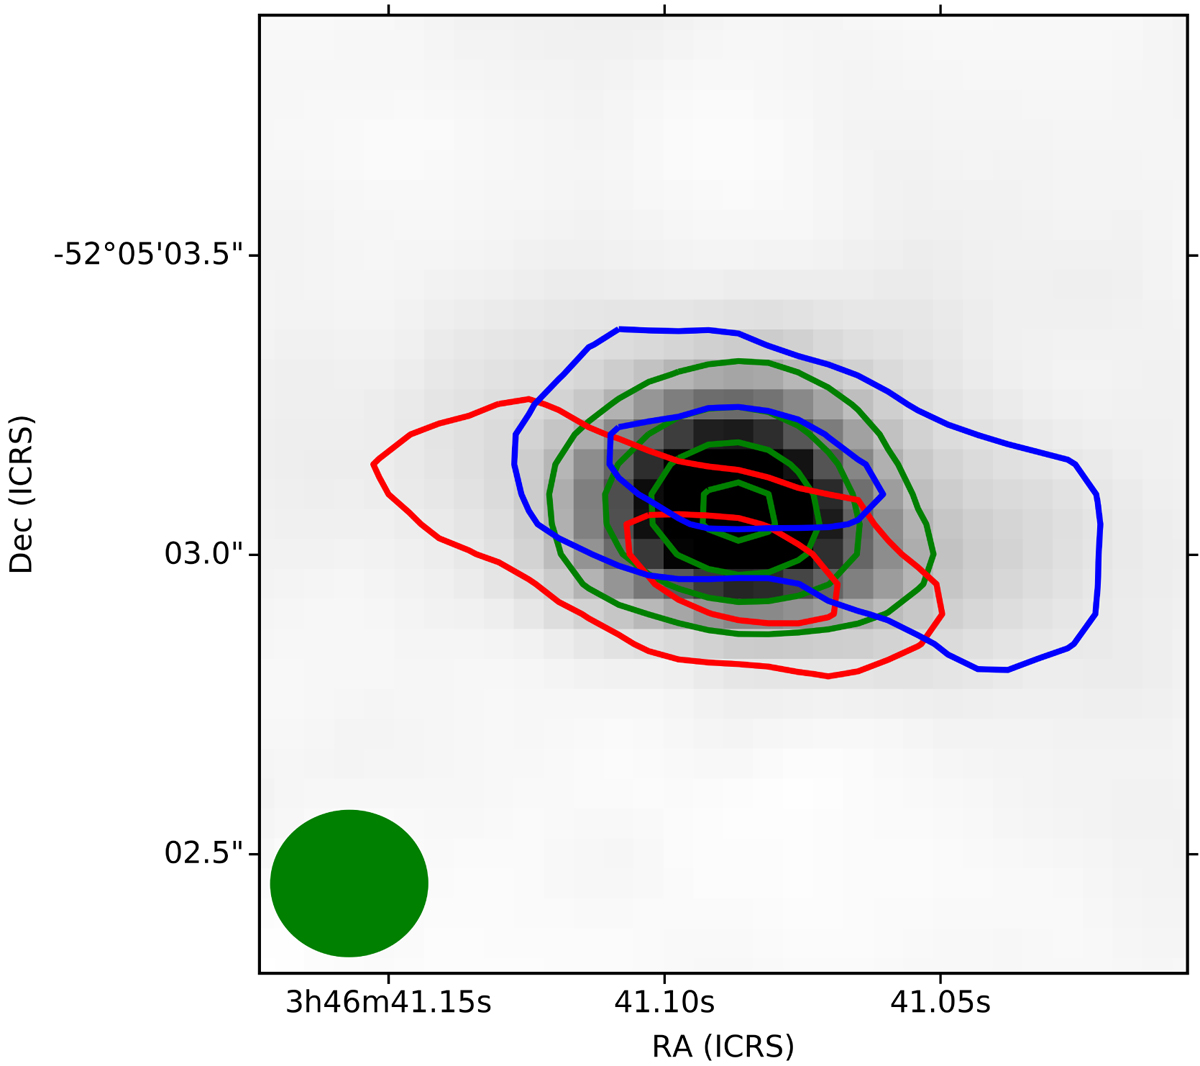
Red and blue halves of the [C II] emission in red and blue contours respectively, together with the rest-frame 158 μm continuum in green and greyscale (Litke et al. 2019). Data were taken from the ALMA archive and passed through the automatic CASA calibration pipeline. A flat continuum was fit to the uv-space data using all line-free channels, and this continuum was subtracted using the CASA task UVCONTSUB. The continuum image was created with natural weighting using the continuum model subtracted from the full cube, while the line cube was created with the continuum-free visibilities. No lensing correction has been applied (i.e. images are image-plane). [C II] contours are shown at 5,10σ, where 1σ = 0.13 Jy beam−1 km s−1, and 0.16 Jy beam−1 km s−1 for red and blue, respectively. Continuum contours are shown at 10,20,30,40σ, where 1σ = 0.47 mJy beam−1. The continuum peak is clearly located between the red and blue [C II] peaks. The synthesised beam of the continuum image is shown by the filled green ellipse in the lower left.
Current usage metrics show cumulative count of Article Views (full-text article views including HTML views, PDF and ePub downloads, according to the available data) and Abstracts Views on Vision4Press platform.
Data correspond to usage on the plateform after 2015. The current usage metrics is available 48-96 hours after online publication and is updated daily on week days.
Initial download of the metrics may take a while.