Fig. 6.
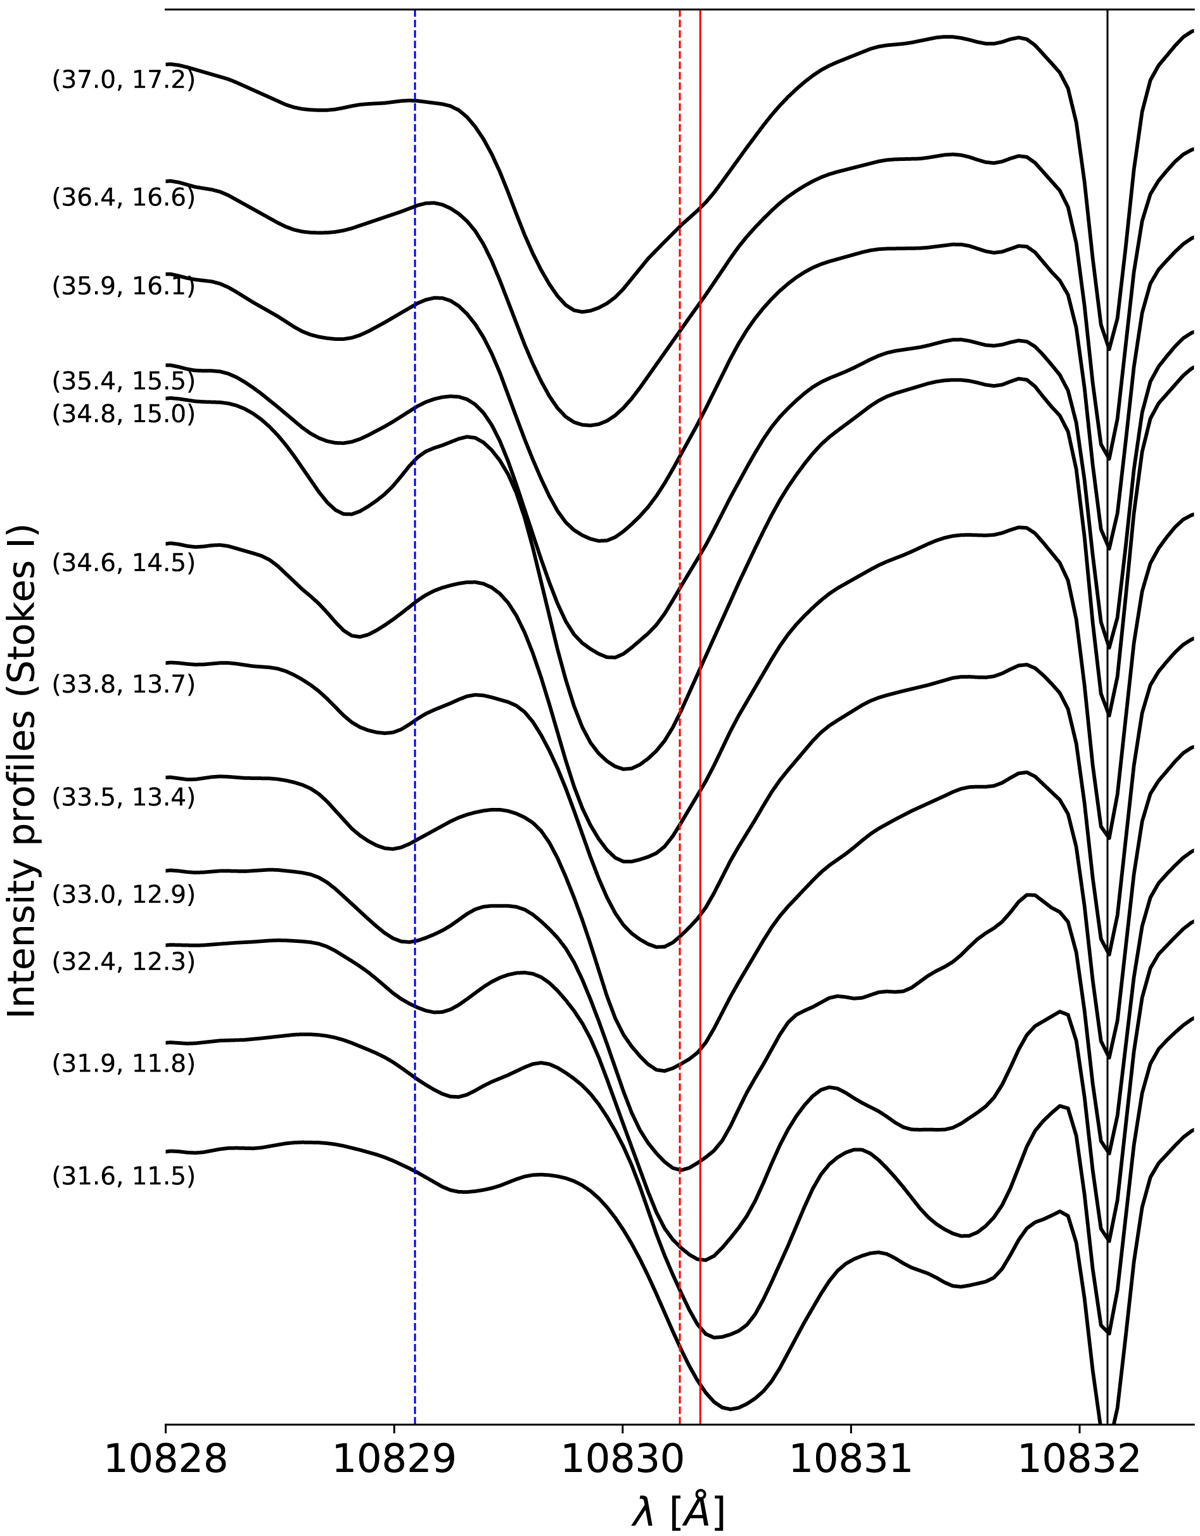
Stokes I profiles along a loop. At the foot-point (lower profile) two velocity components can be seen. The blue dashed, red dashed, solid red, and solid black lines represent the rest wavelength of the He I triplet lines and the telluric line, respectively. The numbers in parentheses denote the position (in arcsec) of the pixels, which are indicated by white cross symbols in Fig. 3.
Current usage metrics show cumulative count of Article Views (full-text article views including HTML views, PDF and ePub downloads, according to the available data) and Abstracts Views on Vision4Press platform.
Data correspond to usage on the plateform after 2015. The current usage metrics is available 48-96 hours after online publication and is updated daily on week days.
Initial download of the metrics may take a while.