Fig. 11.
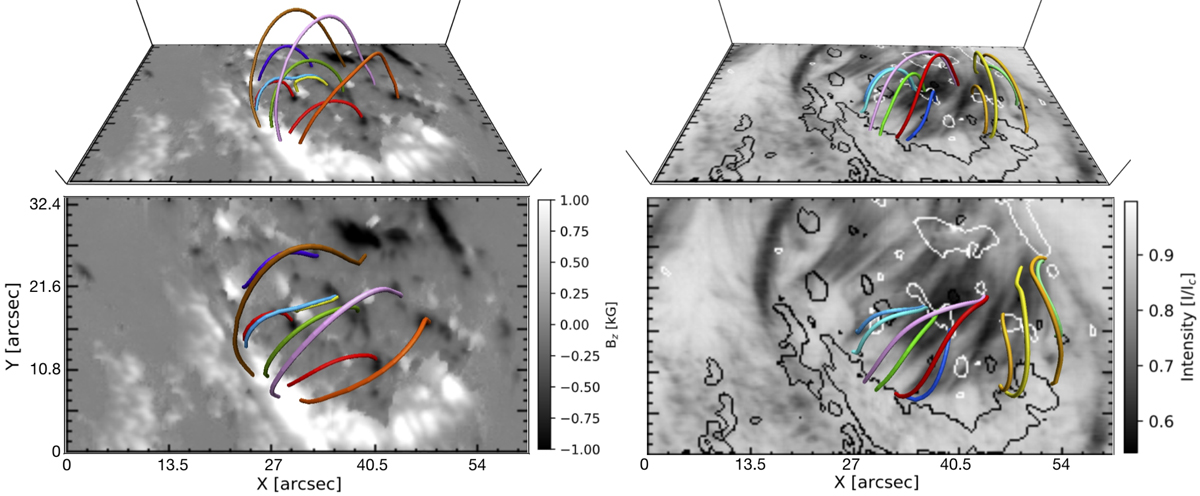
Three-dimensional view of magnetic field lines. Left panels: extrapolated field lines computed using the observed photospheric magnetic field as a lower boundary condition (top panel: lateral view, bottom panel: top view). The Bz component of the magnetic field strength is shown in the background. Right panels: extrapolated field lines computed using the observed chromospheric magnetic field as a lower boundary condition (top panel: lateral view, bottom panel: top view). The intensity image in the background shows He absorption features along the loops; closed black and white contours represent the locations of photospheric positive and negative polarity, respectively.
Current usage metrics show cumulative count of Article Views (full-text article views including HTML views, PDF and ePub downloads, according to the available data) and Abstracts Views on Vision4Press platform.
Data correspond to usage on the plateform after 2015. The current usage metrics is available 48-96 hours after online publication and is updated daily on week days.
Initial download of the metrics may take a while.