Free Access
Fig. 10.
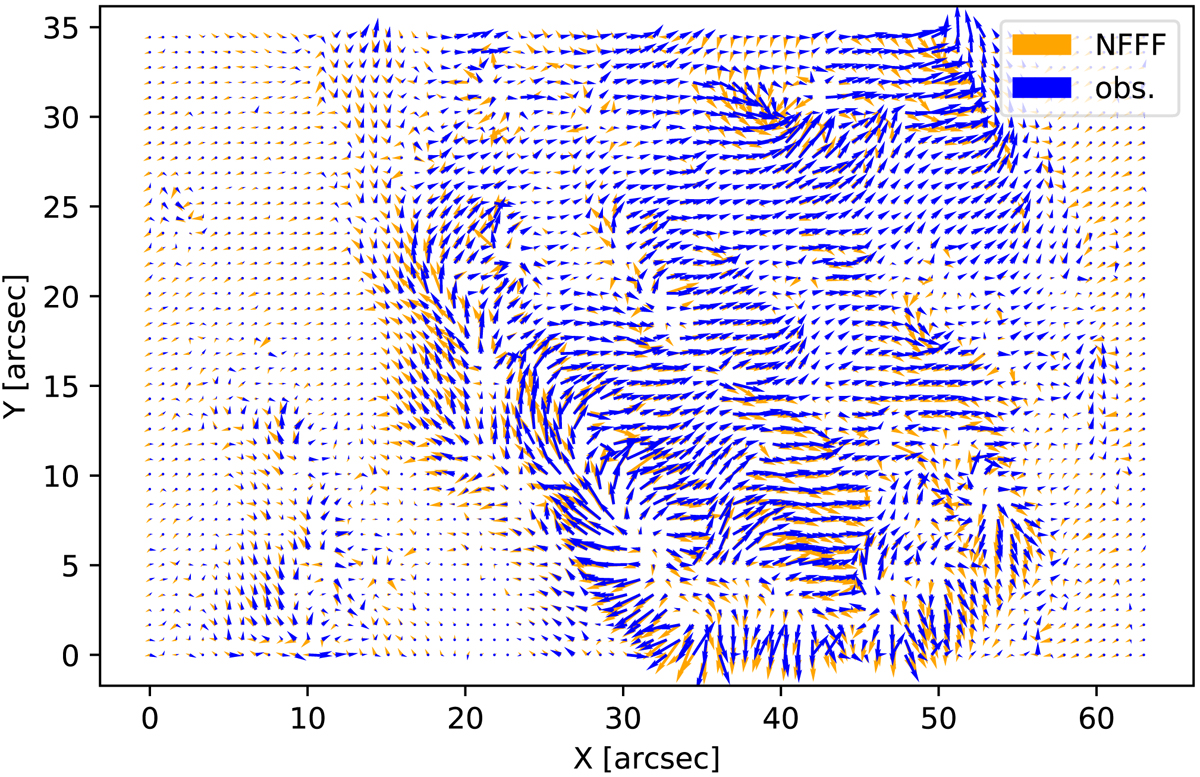
Comparison between the observed and extrapolated horizontal magnetic field. Blue arrows represent the observed horizontal magnetic field derived using the Si I line, whereas orange arrows represent the horizontal magnetic field obtained from extrapolations at the photospheric boundary (z = 0).
Current usage metrics show cumulative count of Article Views (full-text article views including HTML views, PDF and ePub downloads, according to the available data) and Abstracts Views on Vision4Press platform.
Data correspond to usage on the plateform after 2015. The current usage metrics is available 48-96 hours after online publication and is updated daily on week days.
Initial download of the metrics may take a while.