Fig. 1.
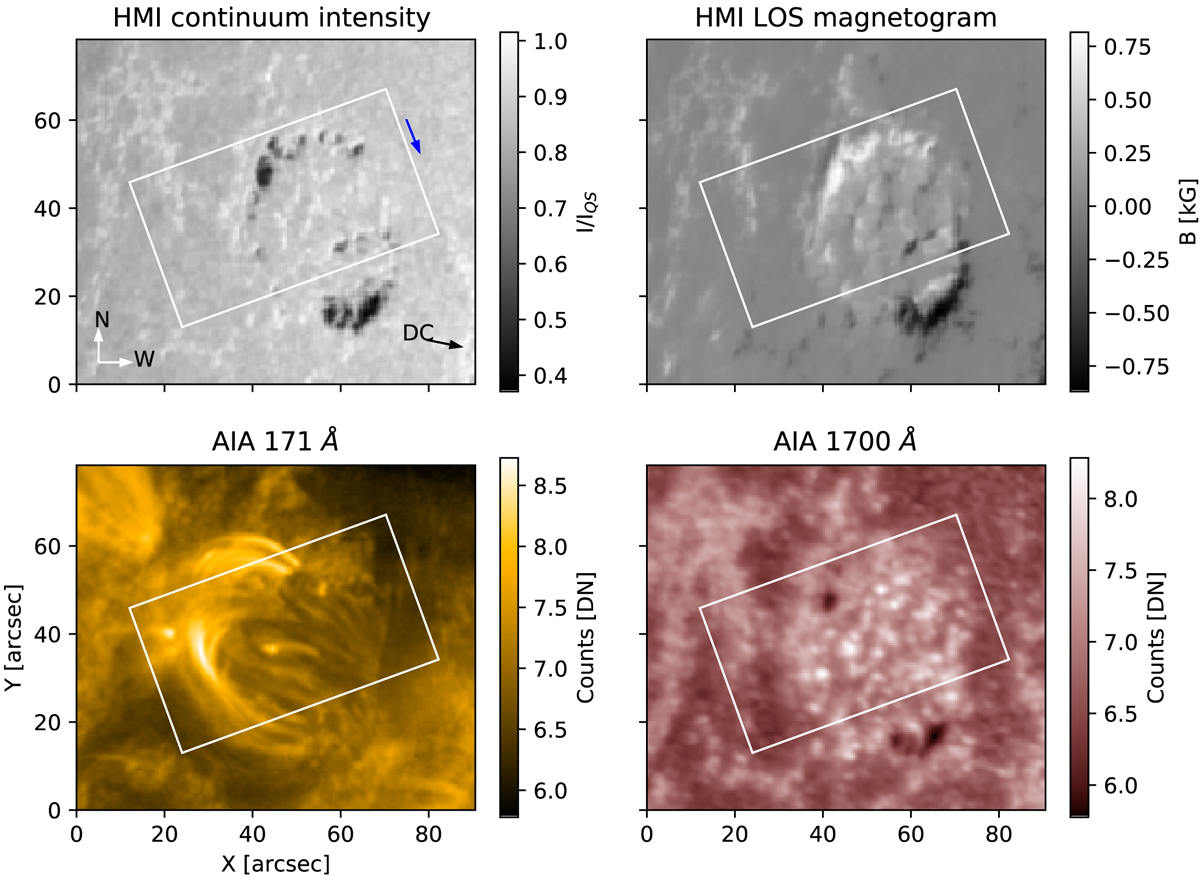
Overview of the observations at 10:36 UT on 3 June, 2015. Top panels: HMI continuum image and LOS magnetogram of the FER. Bottom panels: AIA 171 Å and 1700 Å images of the FER. A white box rectangle outlines the FoV covered by GRIS. Black and blue arrows in the top left panel indicate the direction of the solar disk center and the scanning direction of the slit, respectively. Solar north and west directions are indicated by N and W.
Current usage metrics show cumulative count of Article Views (full-text article views including HTML views, PDF and ePub downloads, according to the available data) and Abstracts Views on Vision4Press platform.
Data correspond to usage on the plateform after 2015. The current usage metrics is available 48-96 hours after online publication and is updated daily on week days.
Initial download of the metrics may take a while.