Fig. 3.
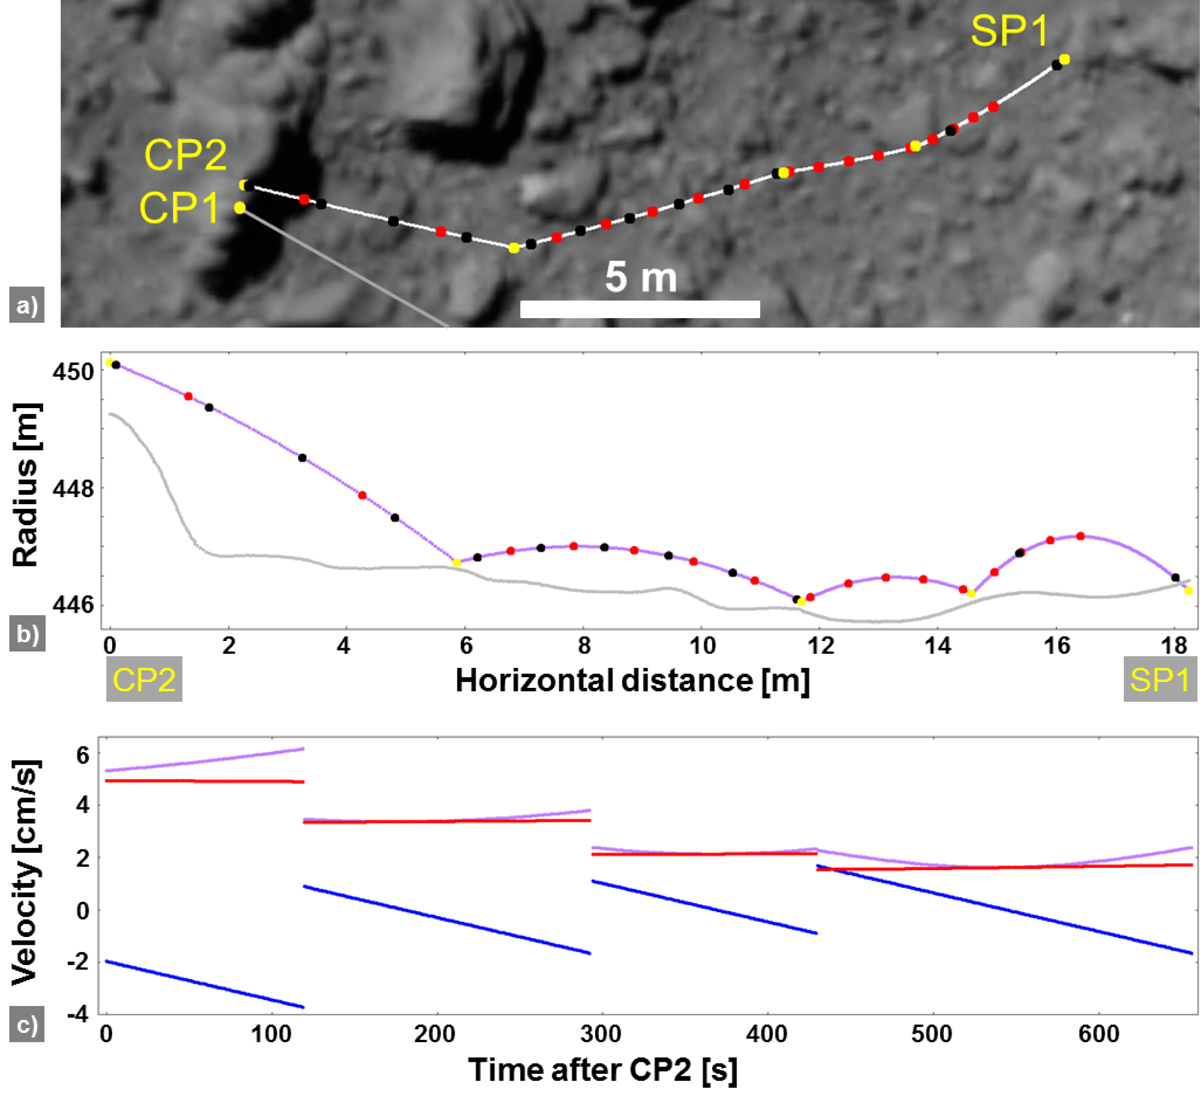
Bouncing phase of MASCOT from second contact (CP2) to its first settlement point (SP1) with events as dots in panels a and b. Yellow dots: positions of contact points, black dots: position of MASCOT when seen in ONC images, red dots: position of MASCOT at the time of sixteen MASCam images. Panel a: ground profile of MASCOT’s bouncing path on top of ONC orthoimage map (thin line: MASCOT’s descent path). Panel b: vertical profile of MASCOT’s bouncing path (purple) and the surface of Ryugu (gray). Panel c: bouncing velocities of MASCOT over time (blue: vertical, red: horizontal, purple: total 3D).
Current usage metrics show cumulative count of Article Views (full-text article views including HTML views, PDF and ePub downloads, according to the available data) and Abstracts Views on Vision4Press platform.
Data correspond to usage on the plateform after 2015. The current usage metrics is available 48-96 hours after online publication and is updated daily on week days.
Initial download of the metrics may take a while.