Fig. 3.
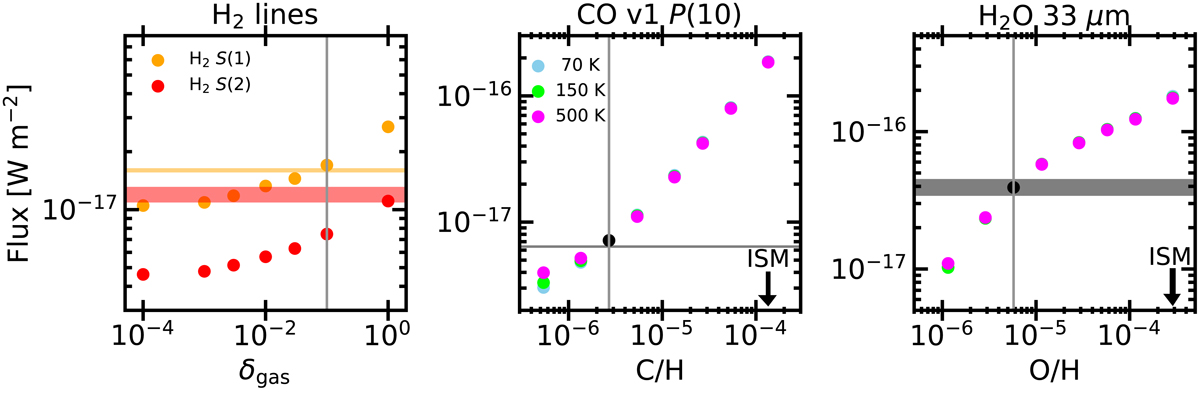
Comparison of the H2 line fluxes (left), CO rovibrational line flux (middle), and the H2O 33 μm feature flux (right) between models and data. Left panel: the amount of gas within 2.4 AU is varied. Middle and right panels: δgas = 0.1 is used and C/H and O/H are varied respectively. Horizontal bands show the 1σ variation of the observed fluxes. The different coloured points denote different values for Tstep. The temperature threshold above which the abundances are varied. The vertical lines in the middle and right panel show the volatile carbon and oxygen abundances assumed for the ISM (Meyer et al. 1998; Lacy et al. 2017).
Current usage metrics show cumulative count of Article Views (full-text article views including HTML views, PDF and ePub downloads, according to the available data) and Abstracts Views on Vision4Press platform.
Data correspond to usage on the plateform after 2015. The current usage metrics is available 48-96 hours after online publication and is updated daily on week days.
Initial download of the metrics may take a while.