Fig. 2.
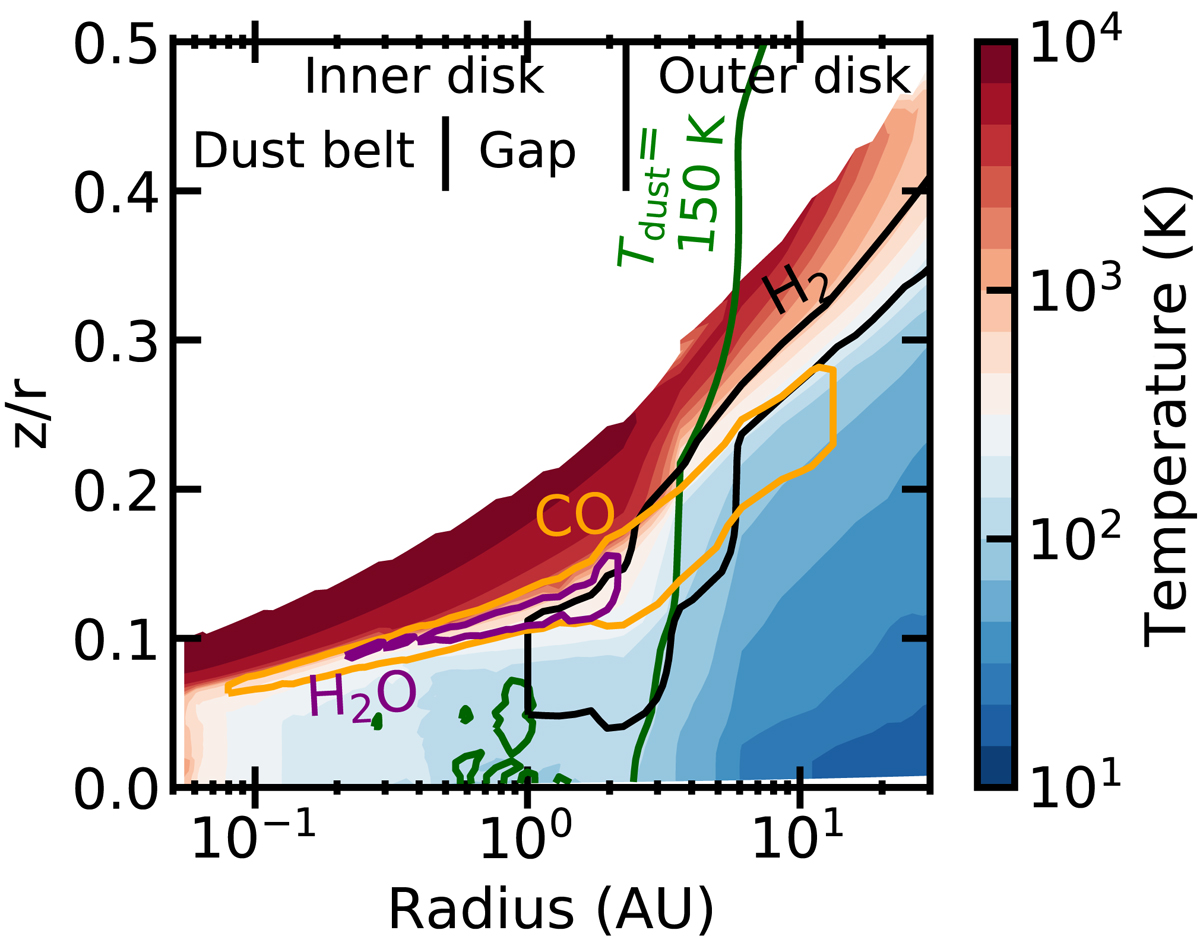
Map of the gas temperature in the inner region of the model together with the emitting areas of the H2 S(1) line (black) the CO v1 vibrational lines (orange) and the strongest line of the H2O 33 μm feature (purple). The green line shows Tdust = 150 K, the approximate location of the H2O ice line. The emitting areas radially overlap in the inner disk.
Current usage metrics show cumulative count of Article Views (full-text article views including HTML views, PDF and ePub downloads, according to the available data) and Abstracts Views on Vision4Press platform.
Data correspond to usage on the plateform after 2015. The current usage metrics is available 48-96 hours after online publication and is updated daily on week days.
Initial download of the metrics may take a while.