Free Access
Fig. 7
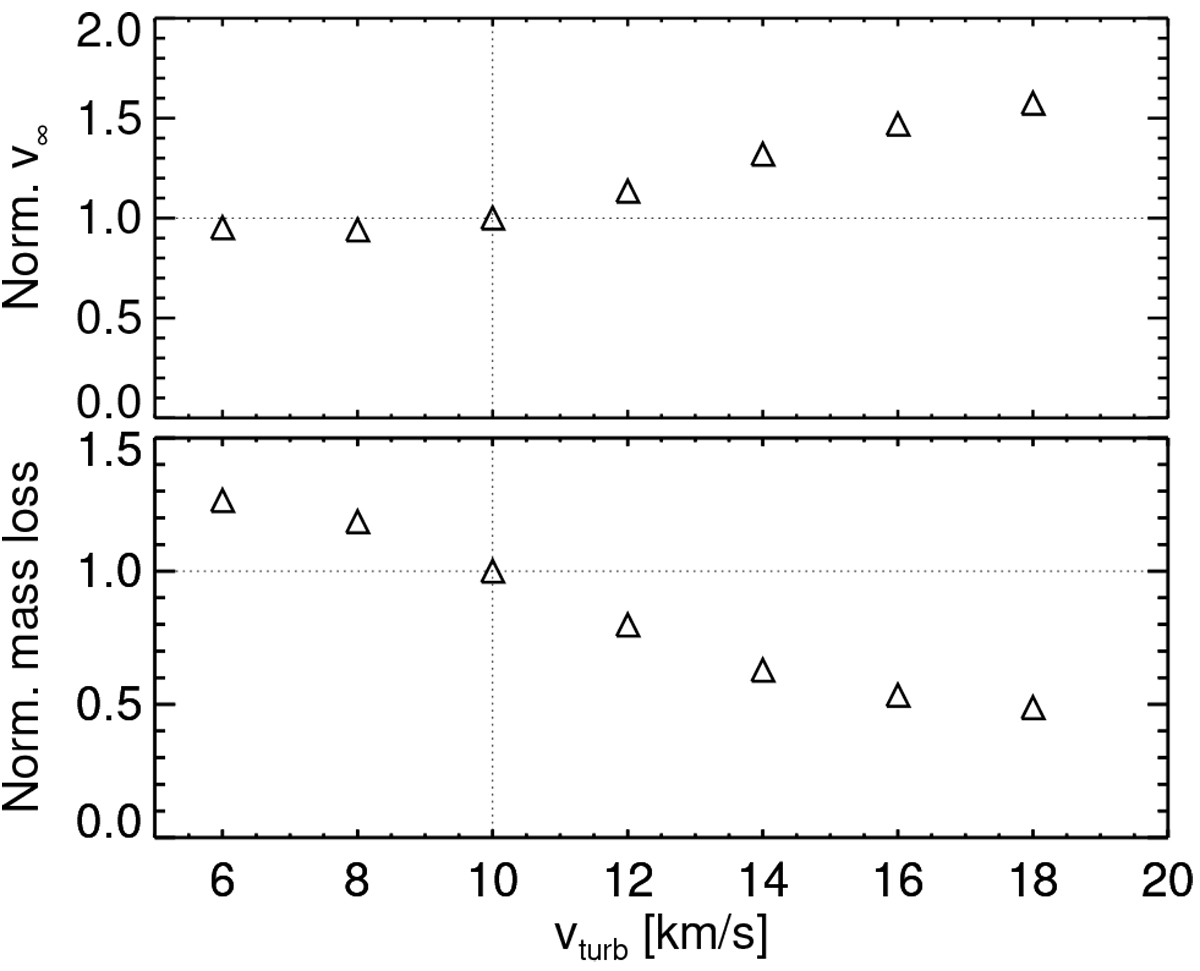
Comparison of early O-star models computed for different values of “micro-turbulent” velocity vturb. Upper panel:compares the computed terminal wind speeds v∞ and lower panel: mass-loss rates Ṁ. Both panels have been normalized to the results of the standard model with vturb = 10 km s−1.
Current usage metrics show cumulative count of Article Views (full-text article views including HTML views, PDF and ePub downloads, according to the available data) and Abstracts Views on Vision4Press platform.
Data correspond to usage on the plateform after 2015. The current usage metrics is available 48-96 hours after online publication and is updated daily on week days.
Initial download of the metrics may take a while.