Fig. 4
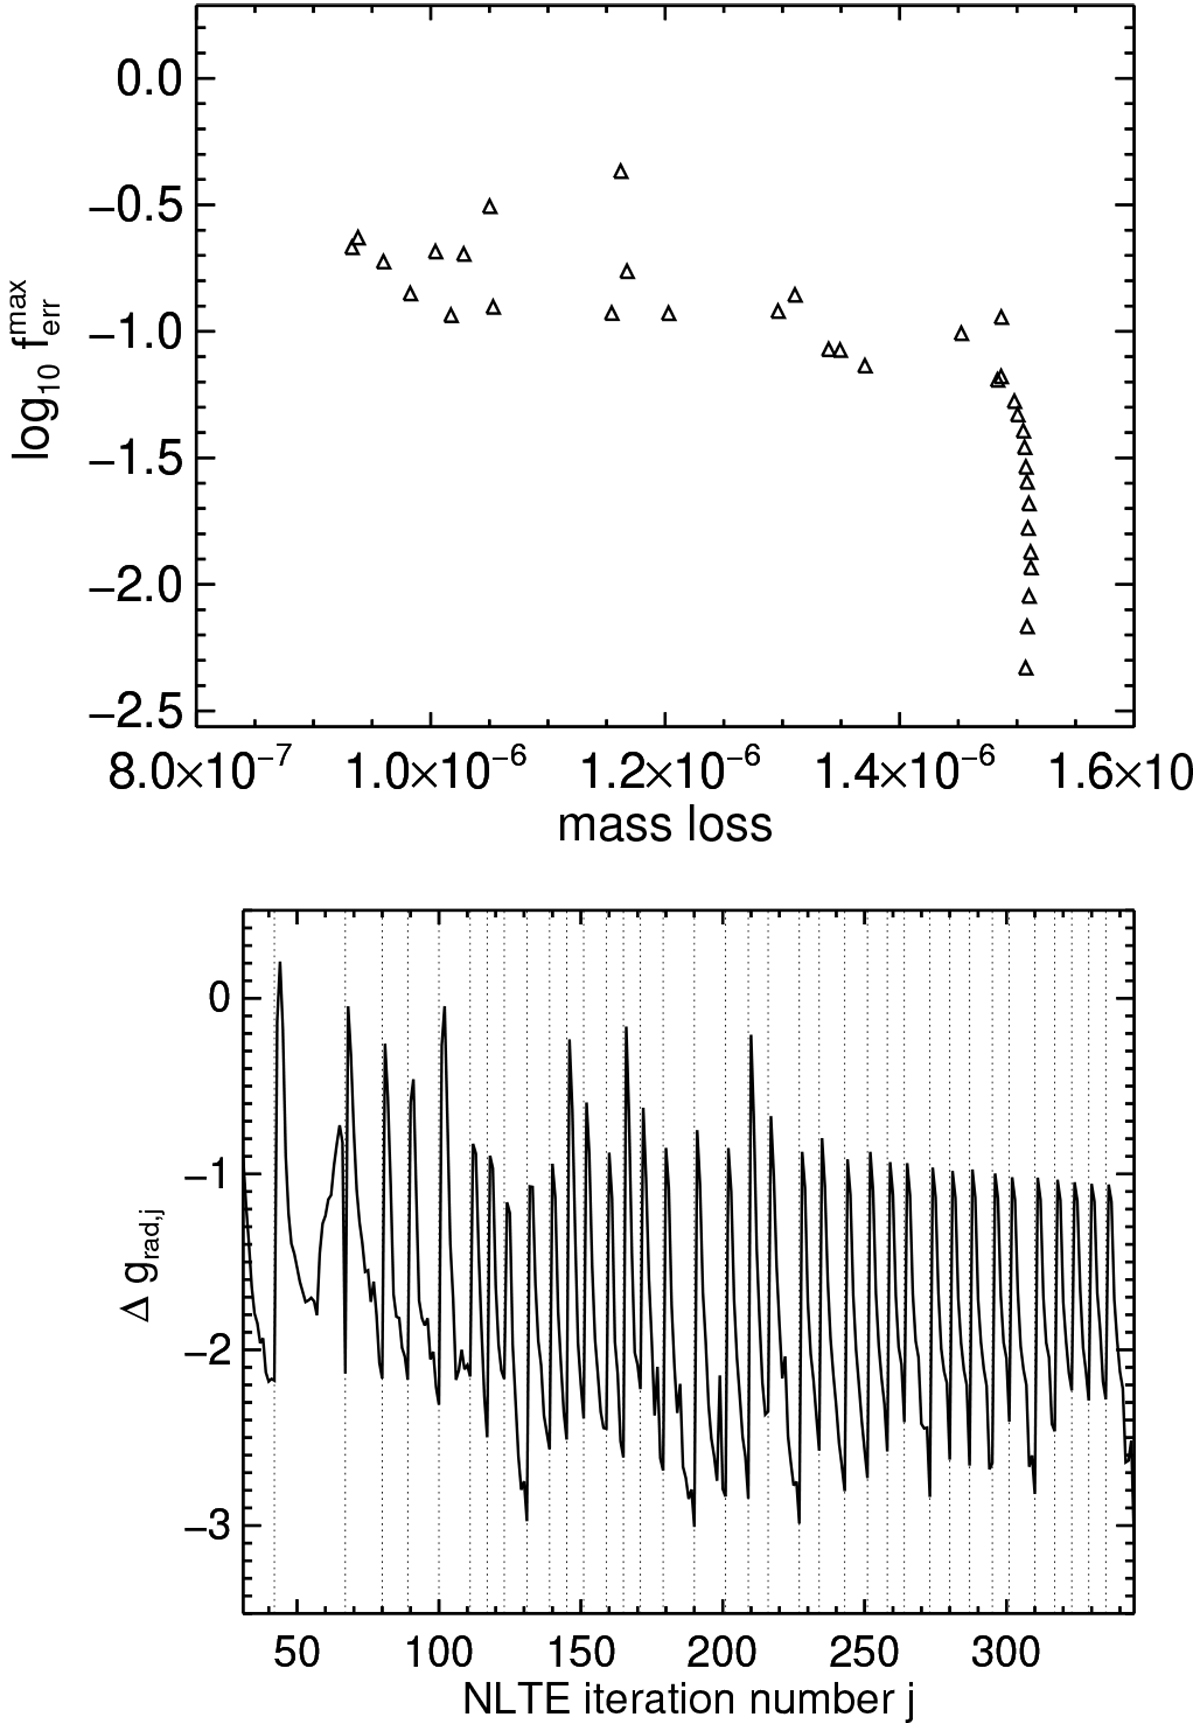
Upperpanel: maximum error in the e.o.m. (triangles) and the corresponding mass-loss rate for each hydrodynamic iteration i. Lower panel: relative change in radiative acceleration between two successive NLTE iterations j − 1 and j. The vertical dotted lines mark NLTE iterations j where hydrodynamic iteration updates i are made. Both panels show results from the early O-star model in Table 1.
Current usage metrics show cumulative count of Article Views (full-text article views including HTML views, PDF and ePub downloads, according to the available data) and Abstracts Views on Vision4Press platform.
Data correspond to usage on the plateform after 2015. The current usage metrics is available 48-96 hours after online publication and is updated daily on week days.
Initial download of the metrics may take a while.