Fig. 1
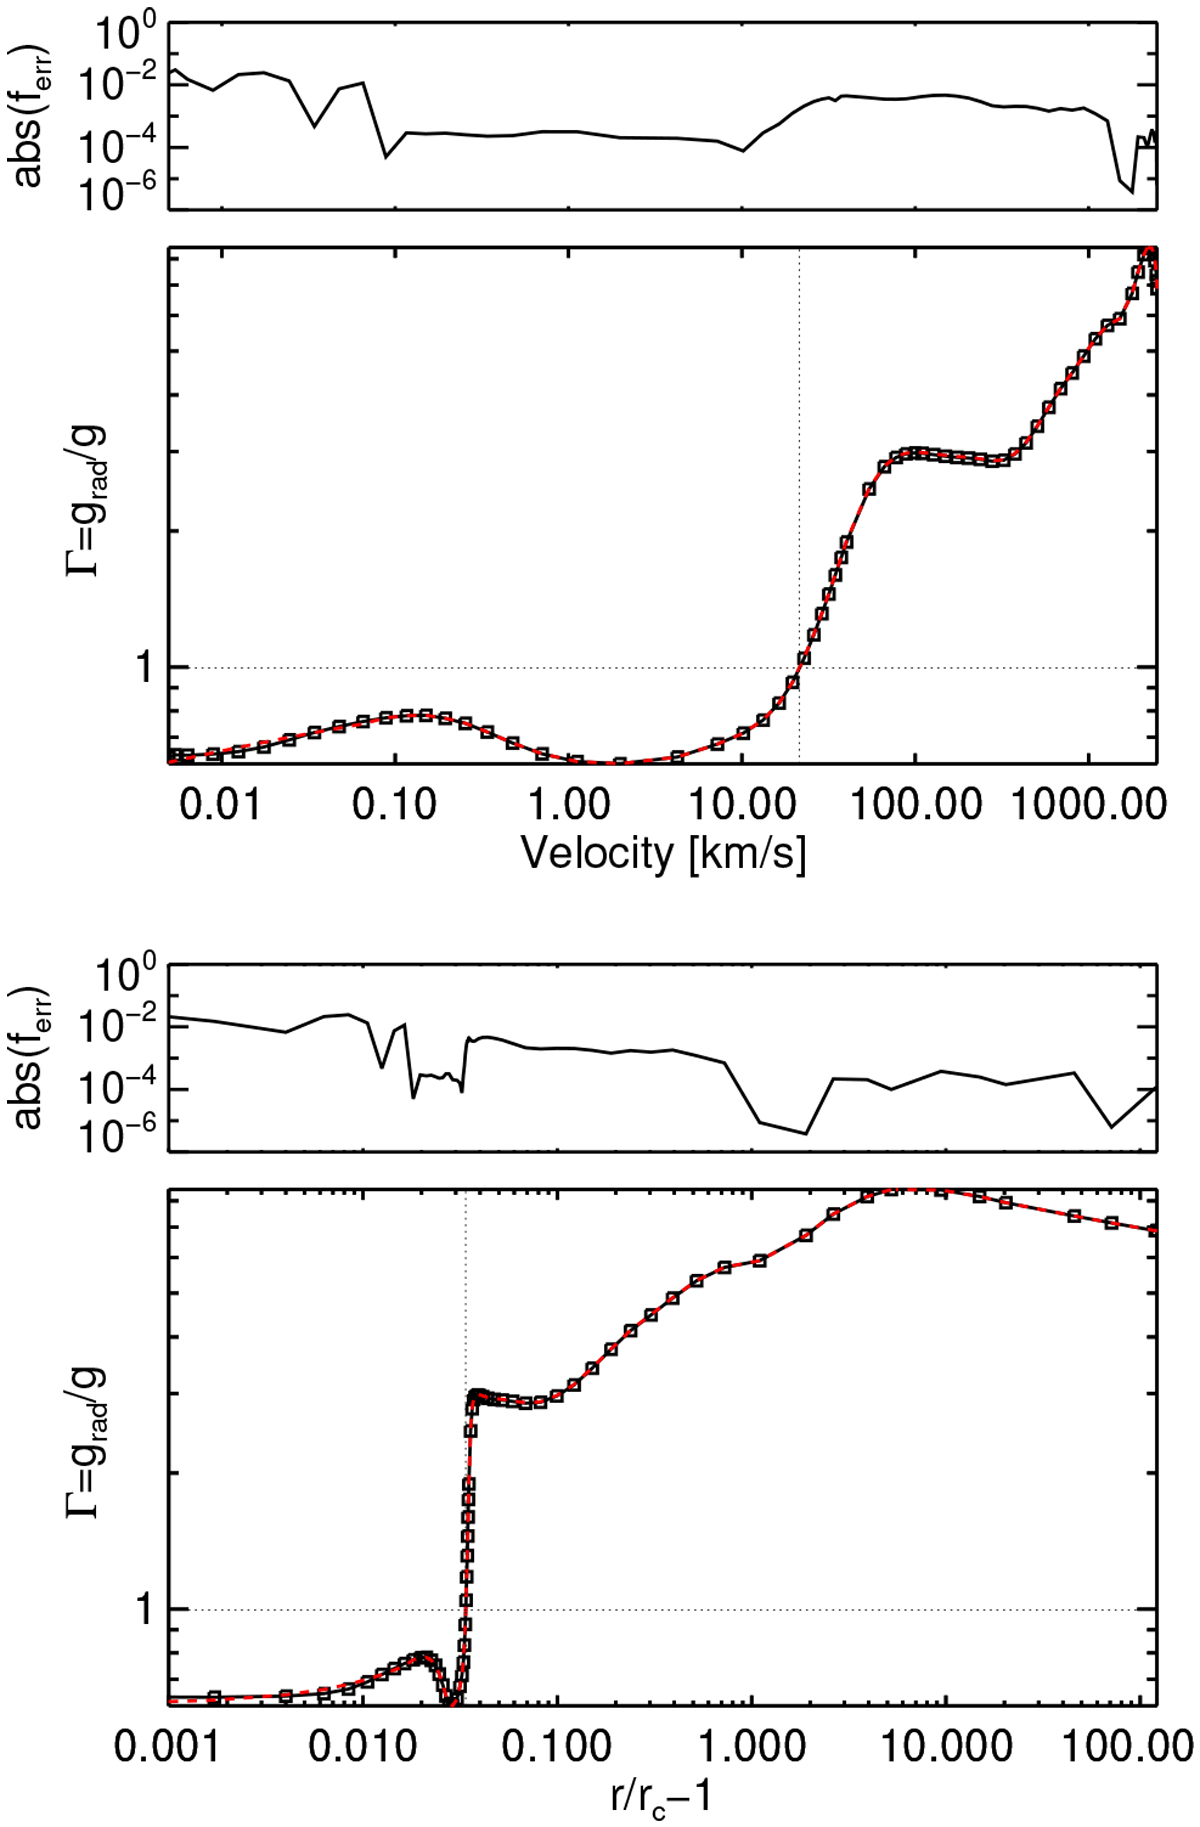
Final force balance for the early O-star model in Table 1. Lower panels of both figures: the solid lines and black squares show Γ = grad ∕g on the discrete mesh points and the red dashed line values for the rest of the terms in the e.o.m., Eq. (2), i.e., (1 − 2a2∕r + da2∕dr + vdv∕dr(1 − a2∕v2))∕g. Since the e.o.m. is perfectly fulfilled, the solid black and dashed red lines lie directly on top of each other in the figure. The dotted lines mark the sonic point v = a. Upper panels: absolute value of the error ferr (Eq. (13)) in the e.o.m. The abscissae in the upper figure show velocity v and in the lower scaled radius r∕rc − 1, with rc the lower boundary radius of the simulation.
Current usage metrics show cumulative count of Article Views (full-text article views including HTML views, PDF and ePub downloads, according to the available data) and Abstracts Views on Vision4Press platform.
Data correspond to usage on the plateform after 2015. The current usage metrics is available 48-96 hours after online publication and is updated daily on week days.
Initial download of the metrics may take a while.