Fig. 10
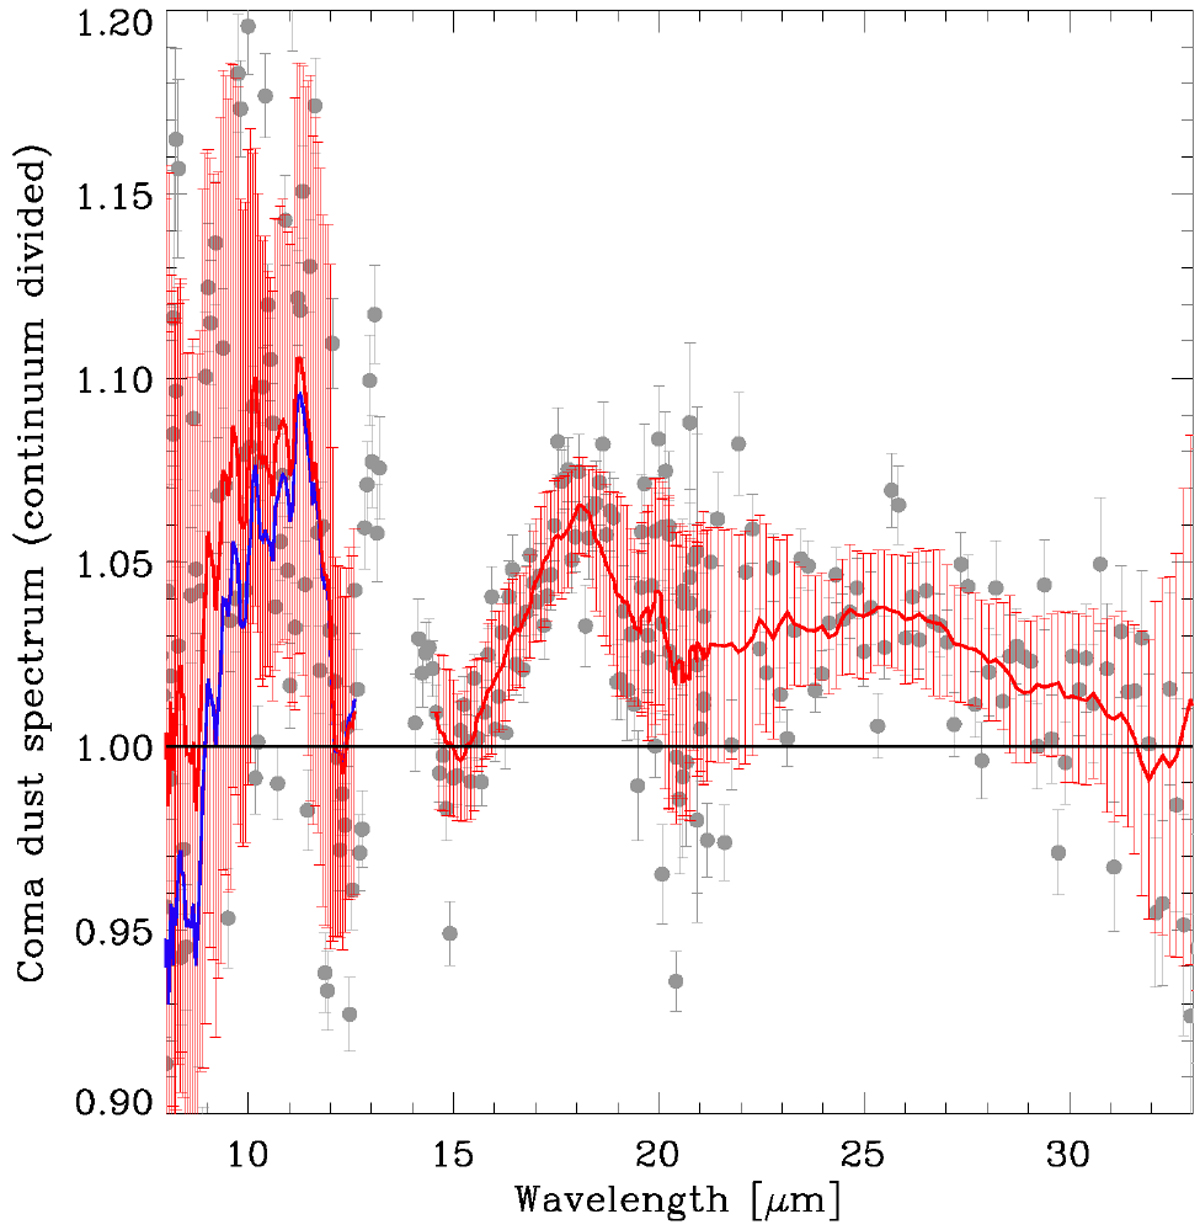
Coma dust spectrum of comet 8P/Tuttle, continuum divided and normalized to unity at 13.0 μm. The red line corresponds to a smoothing over the data points, with a smoothing window of 15 data points. The red error bars correspond to the variance of the data points within the smoothing window. The blue line shows the spectrum in the SL mode assuming a single temperature for the dust coma, which causes the continuum to be overestimated around 8 μm (see text fordetails).
Current usage metrics show cumulative count of Article Views (full-text article views including HTML views, PDF and ePub downloads, according to the available data) and Abstracts Views on Vision4Press platform.
Data correspond to usage on the plateform after 2015. The current usage metrics is available 48-96 hours after online publication and is updated daily on week days.
Initial download of the metrics may take a while.