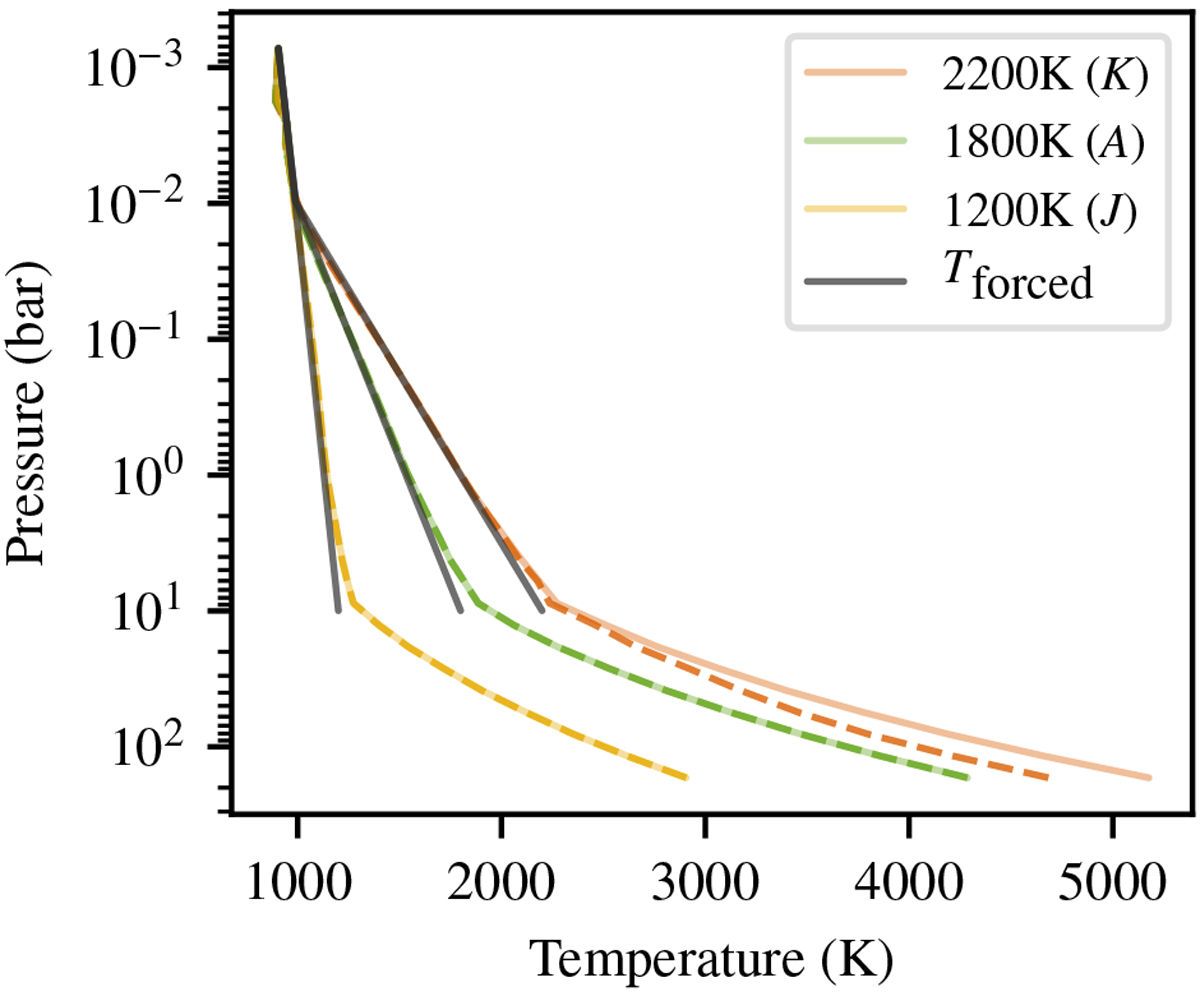
Fig. 8

Equatorially averaged T–P profiles for three models: A (green), J (yellow) and K (orange). The orange (K) and yellow (J) models have had their outer atmosphere cooling modified such that Teq = 2200 K or 1200 K, respectively. The solid lines represent the equilibrium T–P profiles whilst the dashed lines represent the T–P profiles 200 yr after the outer atmosphere forcing was adjusted (shown in dark grey for each model). We note that after 200 yr of “modified” evolution, only the 2200 K model has not reached equilibrium.
Current usage metrics show cumulative count of Article Views (full-text article views including HTML views, PDF and ePub downloads, according to the available data) and Abstracts Views on Vision4Press platform.
Data correspond to usage on the plateform after 2015. The current usage metrics is available 48-96 hours after online publication and is updated daily on week days.
Initial download of the metrics may take a while.


