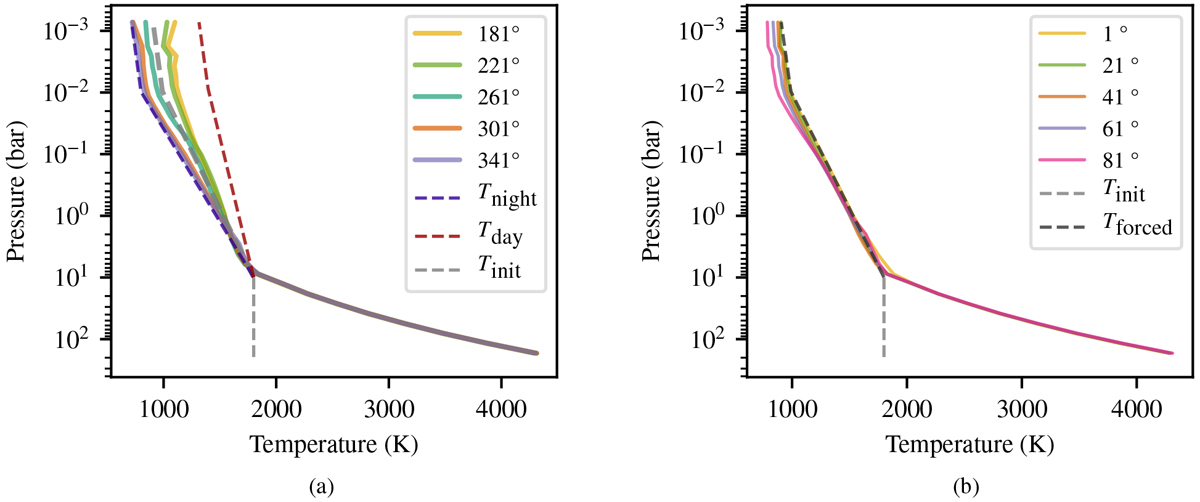
Fig. 6

Snapshots of the latitudinally (a) or longitudinally (b) averaged T–P profile within model A at various longitudes or latitudes, respectively. In each plot, the solid lines represent the various T–P profiles considered. At low pressures (P < 10 bar), the dashed lines represent the days-side, night-side, and equilibrium profiles (in the longitudinal plot, a), or the reference Newtonian cooling (in the latitudinal plot, b), whereas at high pressures (P > 10 bar), the dashed lines (light grey) represent the initial state of the atmosphere.
Current usage metrics show cumulative count of Article Views (full-text article views including HTML views, PDF and ePub downloads, according to the available data) and Abstracts Views on Vision4Press platform.
Data correspond to usage on the plateform after 2015. The current usage metrics is available 48-96 hours after online publication and is updated daily on week days.
Initial download of the metrics may take a while.


