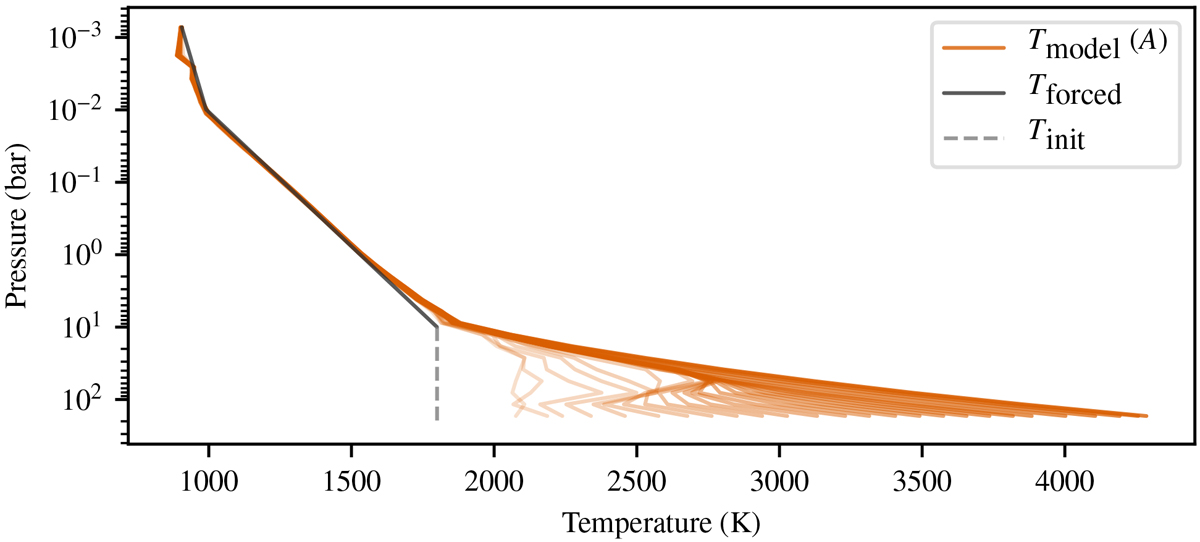
Fig. 4

Time evolution of the equatorially averaged T–P profile within model A covering the >1500 (Earth) yr of simulation time required for it to reach equilibrium. The light grey dashed line shows the initial temperature profile for P > 10 bar, whilst the dark grey line shows the forcing profile for P < 10 bar. The time evolution is represented by the intensity of the lines, with the least evolved (and thus lowest visual intensity) snapshot starting at t ≈30 yr followed by later snapshots at increments of approximately 60 yr.
Current usage metrics show cumulative count of Article Views (full-text article views including HTML views, PDF and ePub downloads, according to the available data) and Abstracts Views on Vision4Press platform.
Data correspond to usage on the plateform after 2015. The current usage metrics is available 48-96 hours after online publication and is updated daily on week days.
Initial download of the metrics may take a while.


