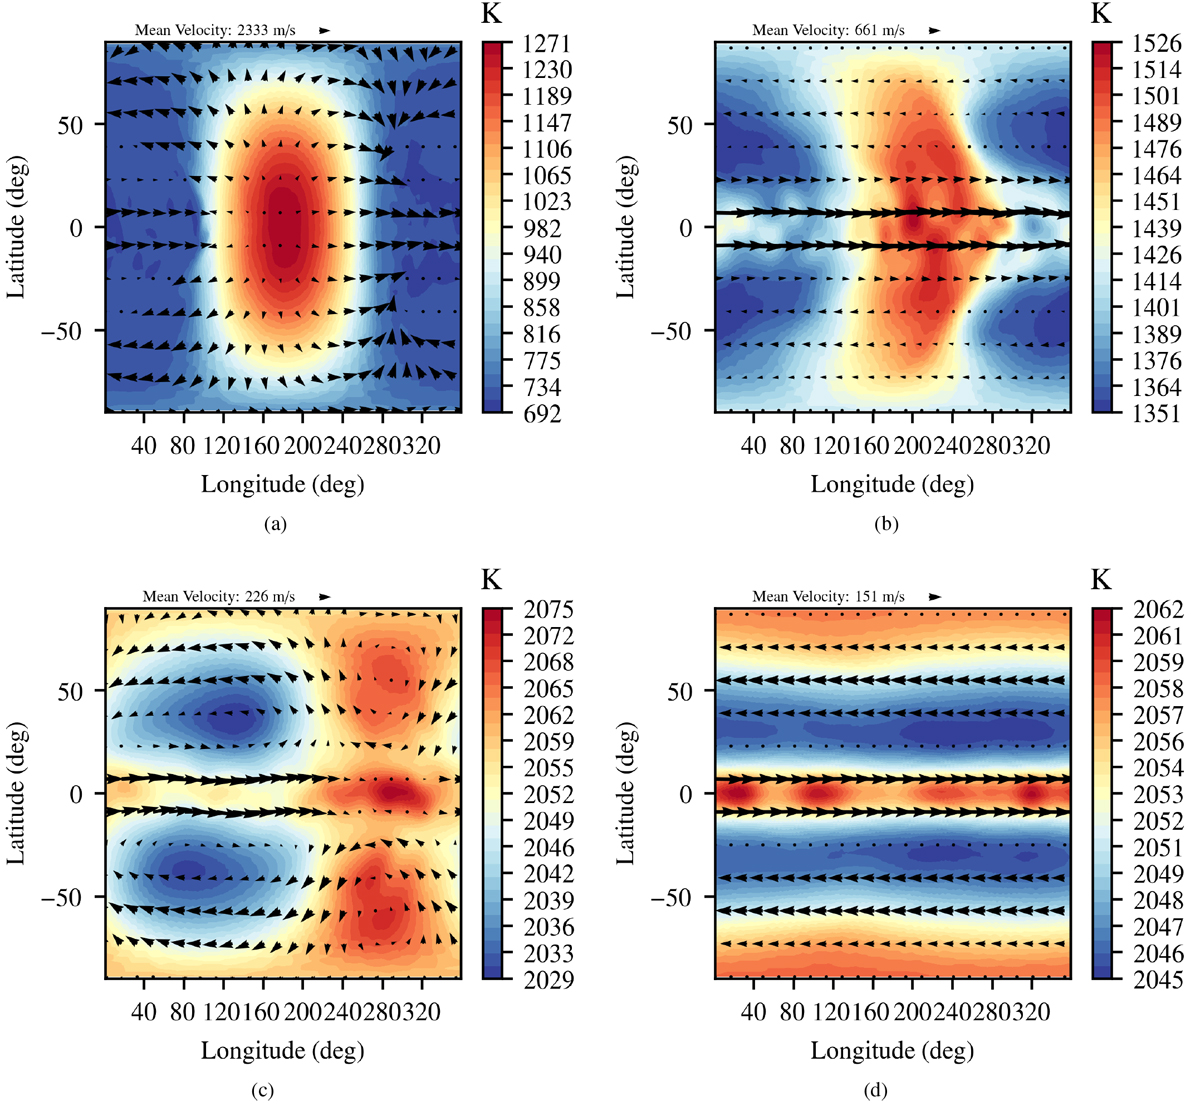
Fig. 3

Zonalwind (arrows) and temperature profile (map) at three different pressures within a fully evolved (i.e. steady-state deep adiabat) model A. The first three panels show snapshots of the profiles at different pressures (P = 0.72 mbar in a, P= 455 mbar in b, and P = 12.7 bar in c), whilst the last (d) shows the time-averaged profiles at the same pressure as panel c in order to illustrate the variable nature of the deep atmosphere. We note that the period of the time average was approximately seven and a half years.
Current usage metrics show cumulative count of Article Views (full-text article views including HTML views, PDF and ePub downloads, according to the available data) and Abstracts Views on Vision4Press platform.
Data correspond to usage on the plateform after 2015. The current usage metrics is available 48-96 hours after online publication and is updated daily on week days.
Initial download of the metrics may take a while.


