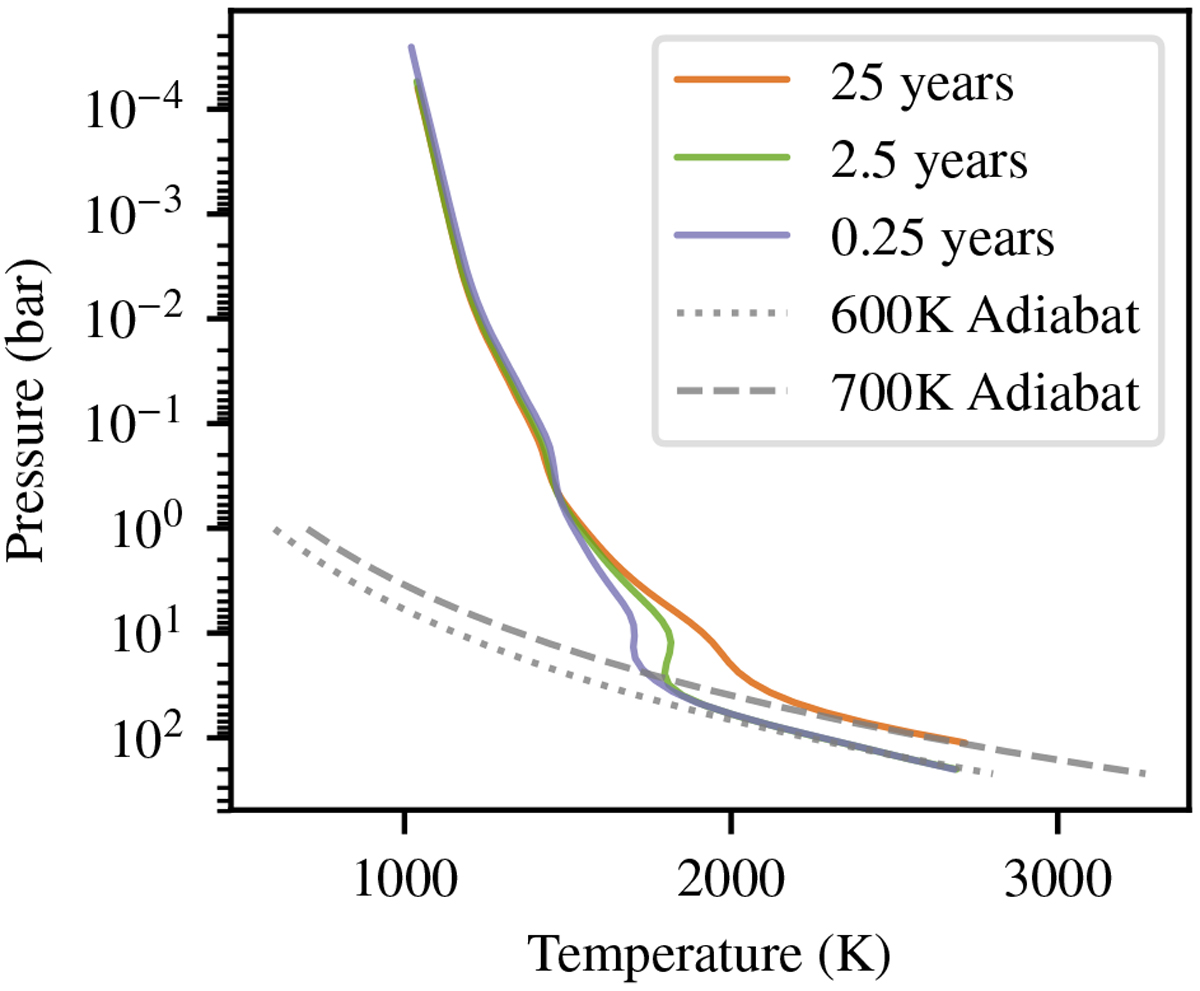
Fig. 12

Evolution of the substellar point (i.e. day-side) temperature–pressure profile in a simulation (detailed in Amundsen et al. 2016)calculated using the Met Office GCM, the Unified Model, (Mayne et al. 2014b), and including a robust two-stream radiation scheme (Amundsen et al. 2014). Here we show snapshots of the T–P profile at 0.25 (purple), 2.5 (green), and25 (orange) Earth years, along with two example adiabats (grey dotted and dashed lines) designed to show how the deep atmosphere gets warmer and connects to steadily warmer adiabats as the simulation progresses. We note that at the end of the simulated time this progression is ongoing towards a deep, hot adiabat, albeit at an increasingly slow rate.
Current usage metrics show cumulative count of Article Views (full-text article views including HTML views, PDF and ePub downloads, according to the available data) and Abstracts Views on Vision4Press platform.
Data correspond to usage on the plateform after 2015. The current usage metrics is available 48-96 hours after online publication and is updated daily on week days.
Initial download of the metrics may take a while.


