Fig. 4.
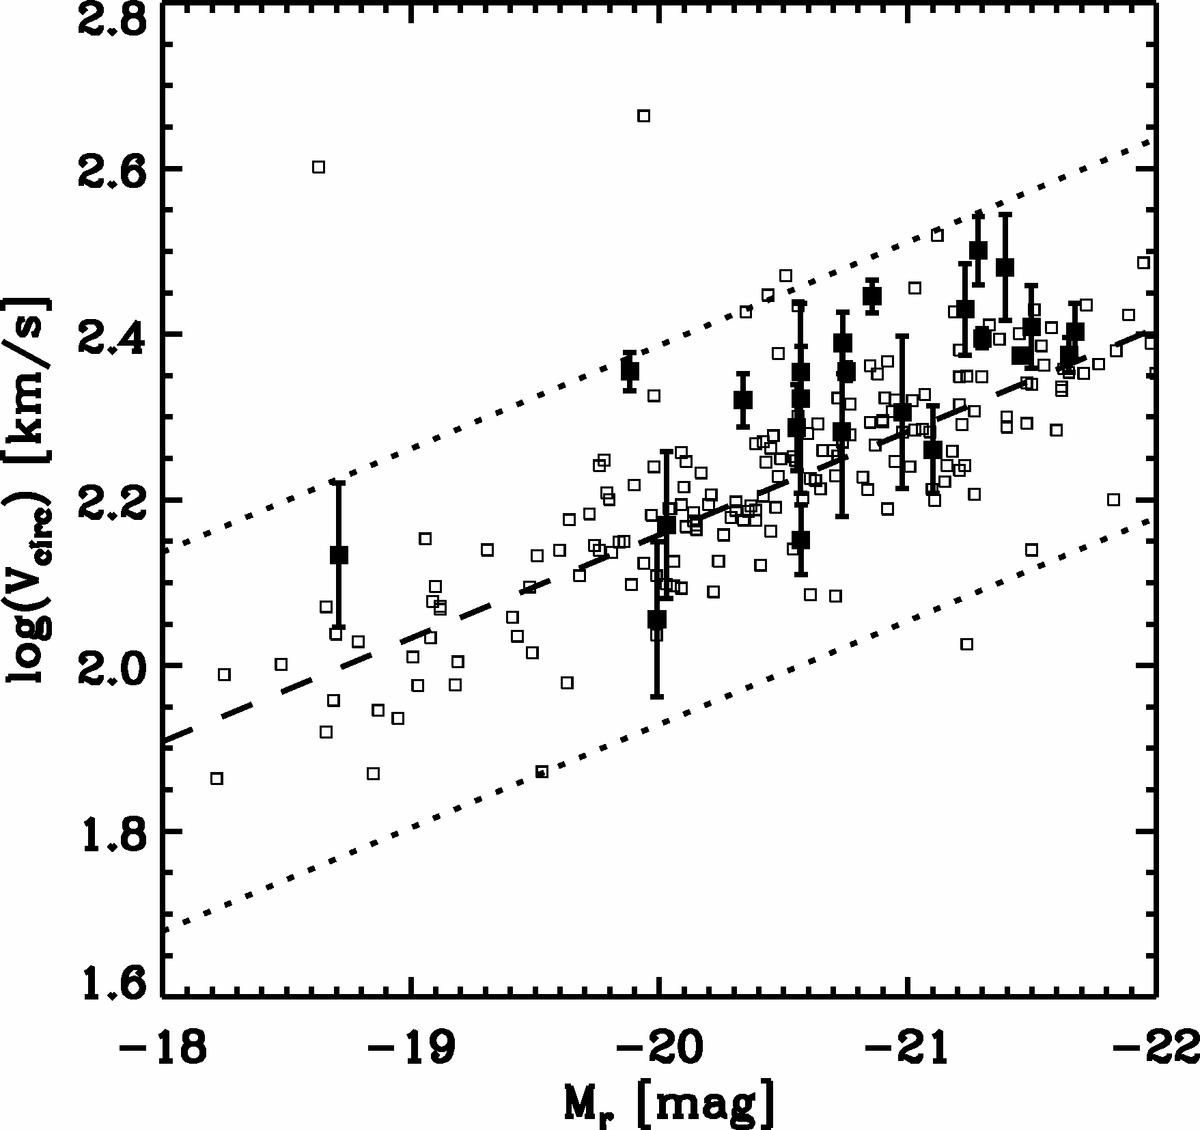
Circular velocity as a function of absolute r band magnitude of the SAB galaxies successfully analysed with the TW method (filled squares) and the galaxy sample of Reyes et al. (2011) (open squares). The dashed line is the best-fitting relation of Reyes et al. (2011) and the dotted lines bracket the region of 3σ deviation in log(Vcirc).
Current usage metrics show cumulative count of Article Views (full-text article views including HTML views, PDF and ePub downloads, according to the available data) and Abstracts Views on Vision4Press platform.
Data correspond to usage on the plateform after 2015. The current usage metrics is available 48-96 hours after online publication and is updated daily on week days.
Initial download of the metrics may take a while.