Free Access
Fig. 3.
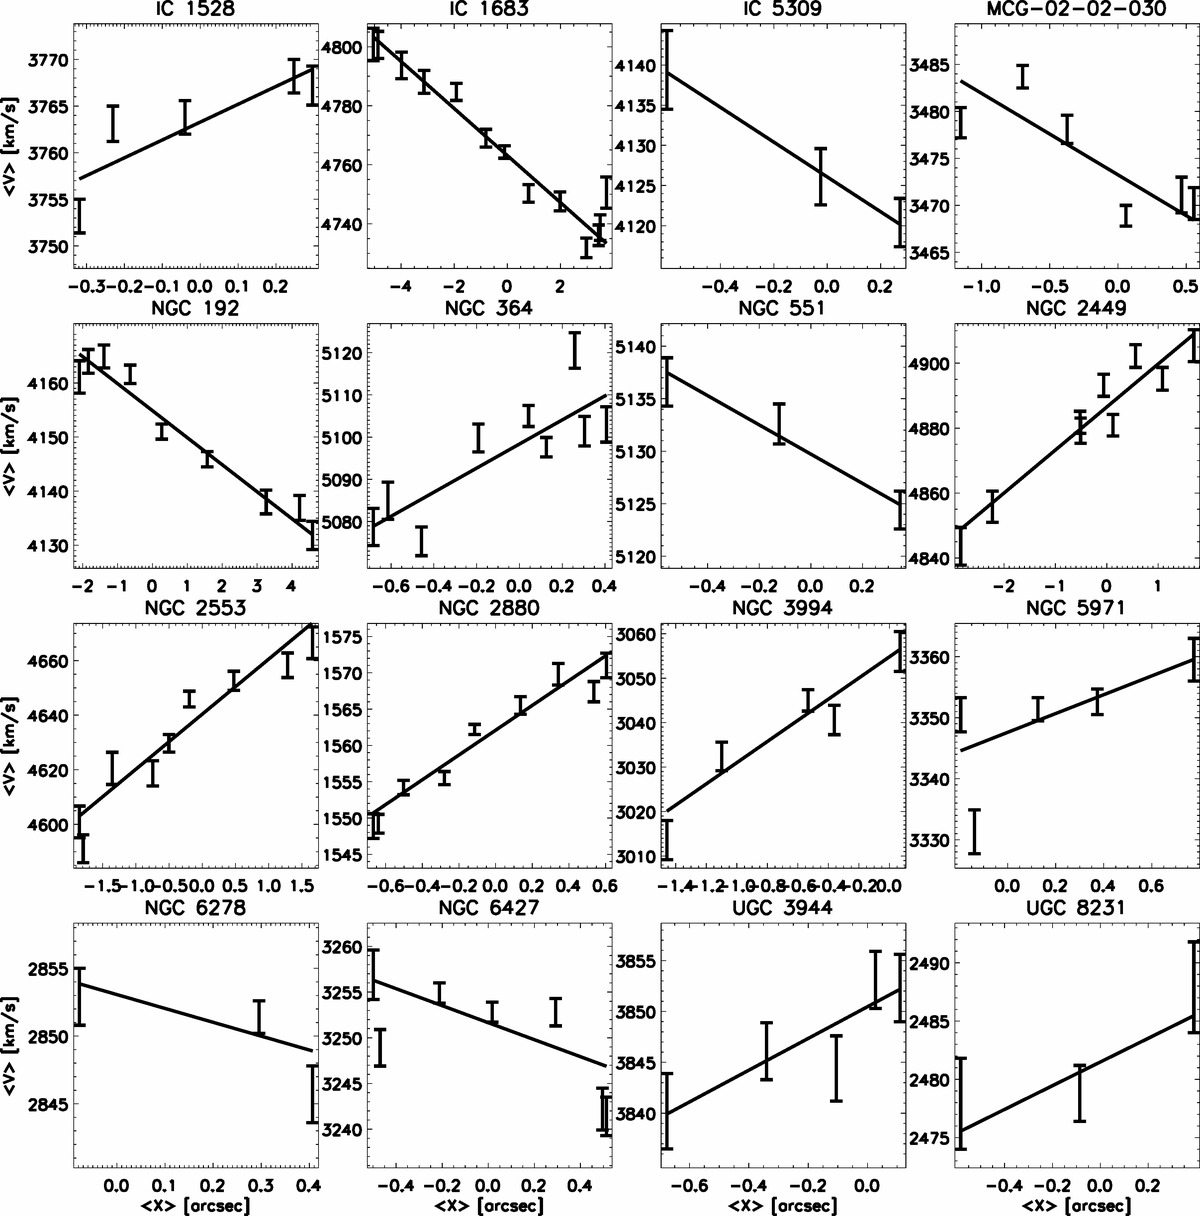
Bar pattern speed of the 16 SAB galaxies shown in Fig. 2. For each galaxy, the kinematic integrals ⟨V⟩ are plotted as a function of the photometric integrals ⟨X⟩ and the best-fitting straight line, which has a slope equal to Ωbar sin i, is overplotted.
Current usage metrics show cumulative count of Article Views (full-text article views including HTML views, PDF and ePub downloads, according to the available data) and Abstracts Views on Vision4Press platform.
Data correspond to usage on the plateform after 2015. The current usage metrics is available 48-96 hours after online publication and is updated daily on week days.
Initial download of the metrics may take a while.