Fig. 1.
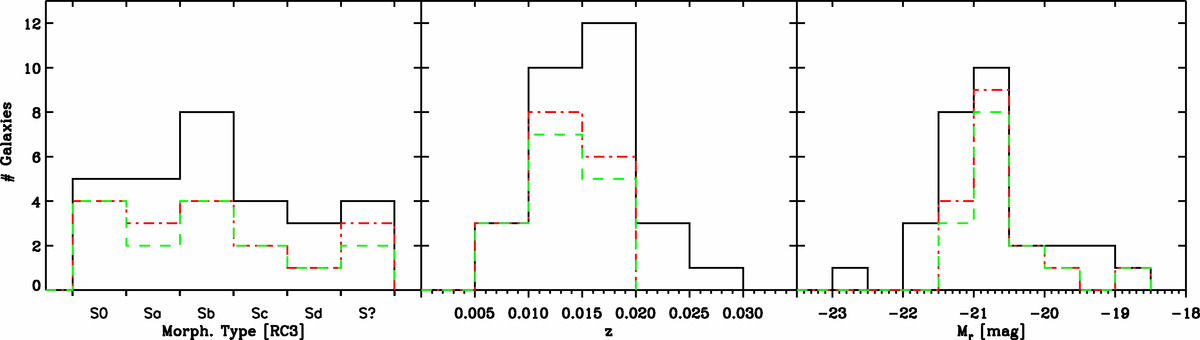
Distribution of the morphological type (left panel), redshift (central panel), and absolute r band magnitude (right panel) of our sample of 29 bona fide SAB galaxies (black solid line), the sample of 16 SAB galaxies successfully analysed with the TW method (red dot-dashed line), and the 14 SAB galaxies hosting a non-ultrafast bar (green dashed line).
Current usage metrics show cumulative count of Article Views (full-text article views including HTML views, PDF and ePub downloads, according to the available data) and Abstracts Views on Vision4Press platform.
Data correspond to usage on the plateform after 2015. The current usage metrics is available 48-96 hours after online publication and is updated daily on week days.
Initial download of the metrics may take a while.