Fig. 7.
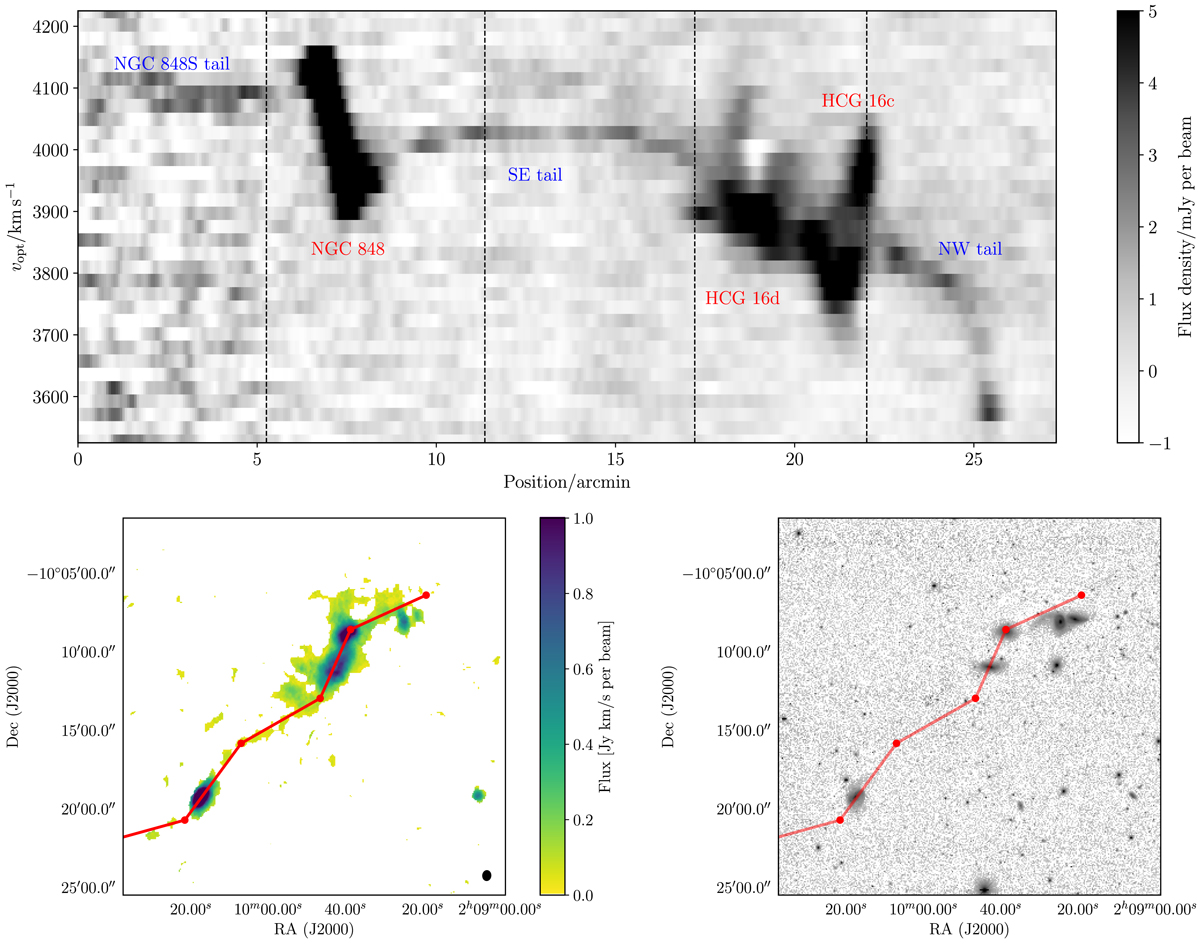
Top: segmented position–velocity diagram showing the spatially and kinematically continuous H I emission spanning HCG 16. The vertical dashed lines show the locations of the nodes making up the segmented slice through the data cube. Galaxies are labelled in red and tidal features in blue. We note that the noise in this plot increases significantly near the left edge as this region is approaching the primary beam edge. Bottom, left panel: position–velocity slice as a segmented red line on top of the moment-zero map (using the standard 3σ threshold mask as in the left panel of Fig. 2) and right panel: same line but overlaid on the DECaLS r-band image.
Current usage metrics show cumulative count of Article Views (full-text article views including HTML views, PDF and ePub downloads, according to the available data) and Abstracts Views on Vision4Press platform.
Data correspond to usage on the plateform after 2015. The current usage metrics is available 48-96 hours after online publication and is updated daily on week days.
Initial download of the metrics may take a while.