Fig. 5.
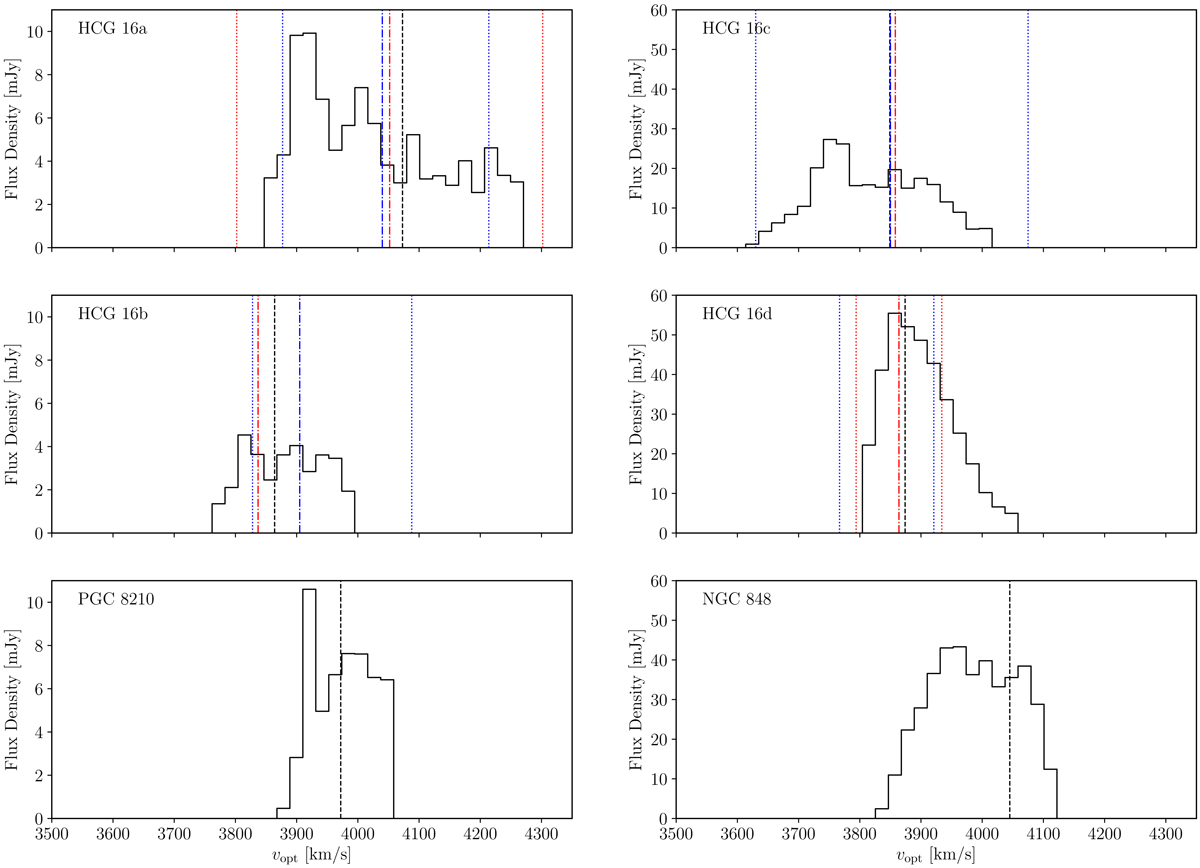
Spectral profiles of each of the six galaxies detected in H I near the core group calculated from the separation of tidal features and galaxies performed in Sect. 3.1. The black vertical dashed lines show the optical redshifts of each galaxy as given in Table 1. The dot-dashed and dotted vertical lines show the central and extreme velocities, respectively, from the rotation curve measurements of Rubin et al. (1991) in red and Mendes de Oliveira et al. (1998) in blue. These measurements are only available for the four core galaxies; also Rubin et al. (1991) do not specify Vmax values for HCG 16b or c due to the peculiar shape of their rotation curves. The left panels have vertical scales that go to 11 mJy, whereas the scales on the right are a factor of approximately six higher (60 mJy).
Current usage metrics show cumulative count of Article Views (full-text article views including HTML views, PDF and ePub downloads, according to the available data) and Abstracts Views on Vision4Press platform.
Data correspond to usage on the plateform after 2015. The current usage metrics is available 48-96 hours after online publication and is updated daily on week days.
Initial download of the metrics may take a while.