Fig. 4.
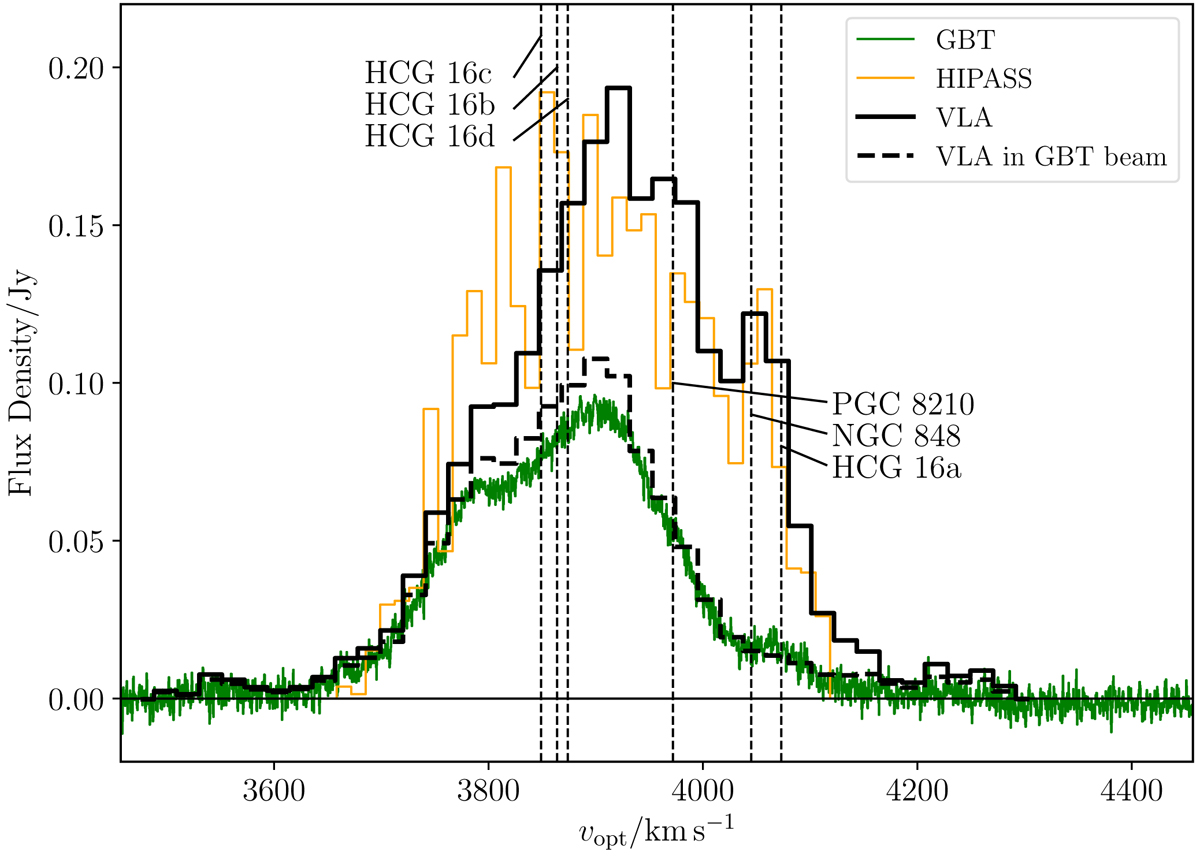
Integrated VLA spectrum of the entire group (thick black line) compared to the GBT spectrum of the core group (Borthakur et al. 2010, high spectral resolution green line), the VLA spectrum within the GBT beam area (thick black dashed line), and the spectrum extracted from the HIPASS cube (orange line). Vertical dashed lines indicate the optical redshifts of the member galaxies.
Current usage metrics show cumulative count of Article Views (full-text article views including HTML views, PDF and ePub downloads, according to the available data) and Abstracts Views on Vision4Press platform.
Data correspond to usage on the plateform after 2015. The current usage metrics is available 48-96 hours after online publication and is updated daily on week days.
Initial download of the metrics may take a while.