Fig. 3.
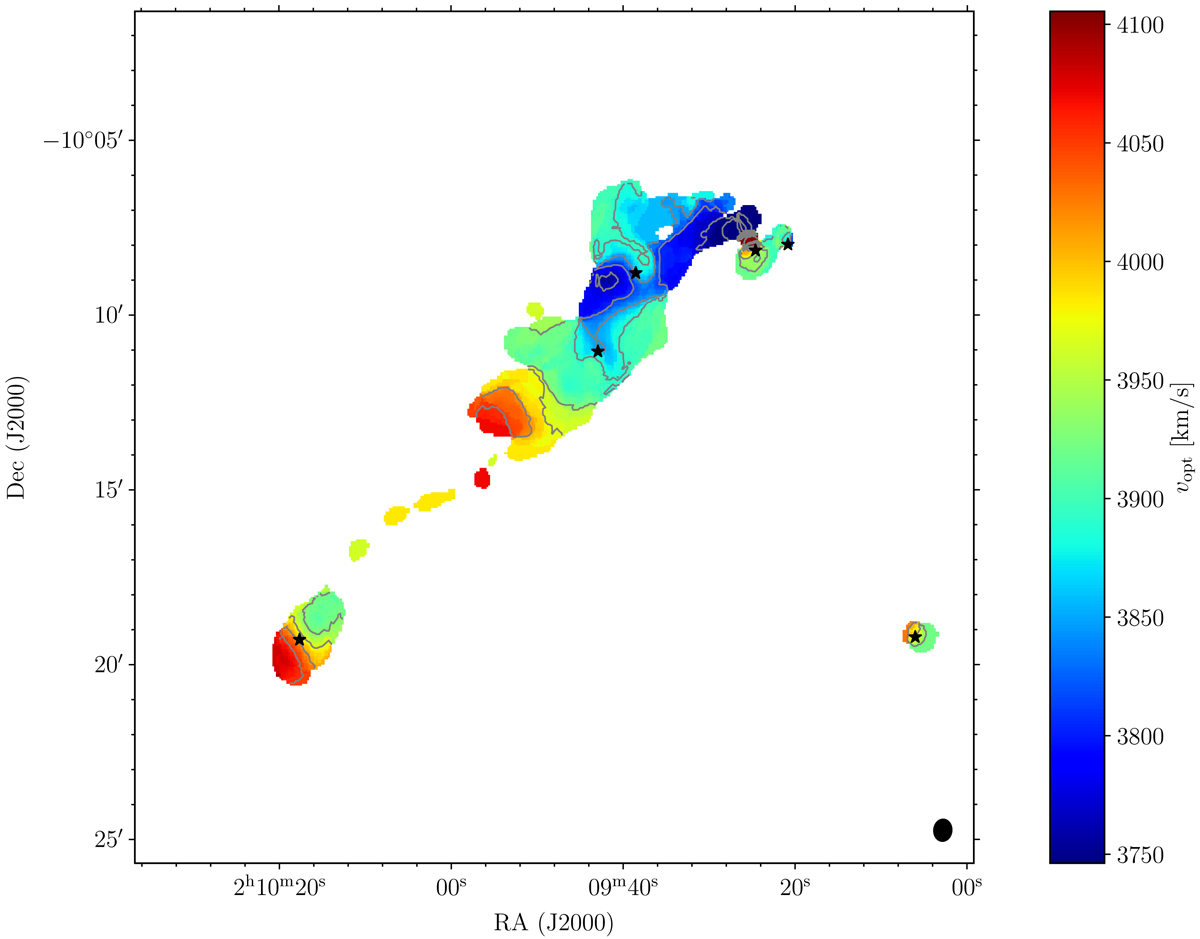
First-moment map of the H I emission calculated using the SoFiA-generated mask with a threshold of 5σrms and without dilation. The rainbow colour scale indicates the recessional (optical) velocity in km s−1. The black ellipse in the lower right indicates the beam size, the grey lines are isovelocity contours separated by 40 km s−1, and the small black star symbols indicate the locations of the optical centres of the galaxies in the group.
Current usage metrics show cumulative count of Article Views (full-text article views including HTML views, PDF and ePub downloads, according to the available data) and Abstracts Views on Vision4Press platform.
Data correspond to usage on the plateform after 2015. The current usage metrics is available 48-96 hours after online publication and is updated daily on week days.
Initial download of the metrics may take a while.