Fig. D.2.
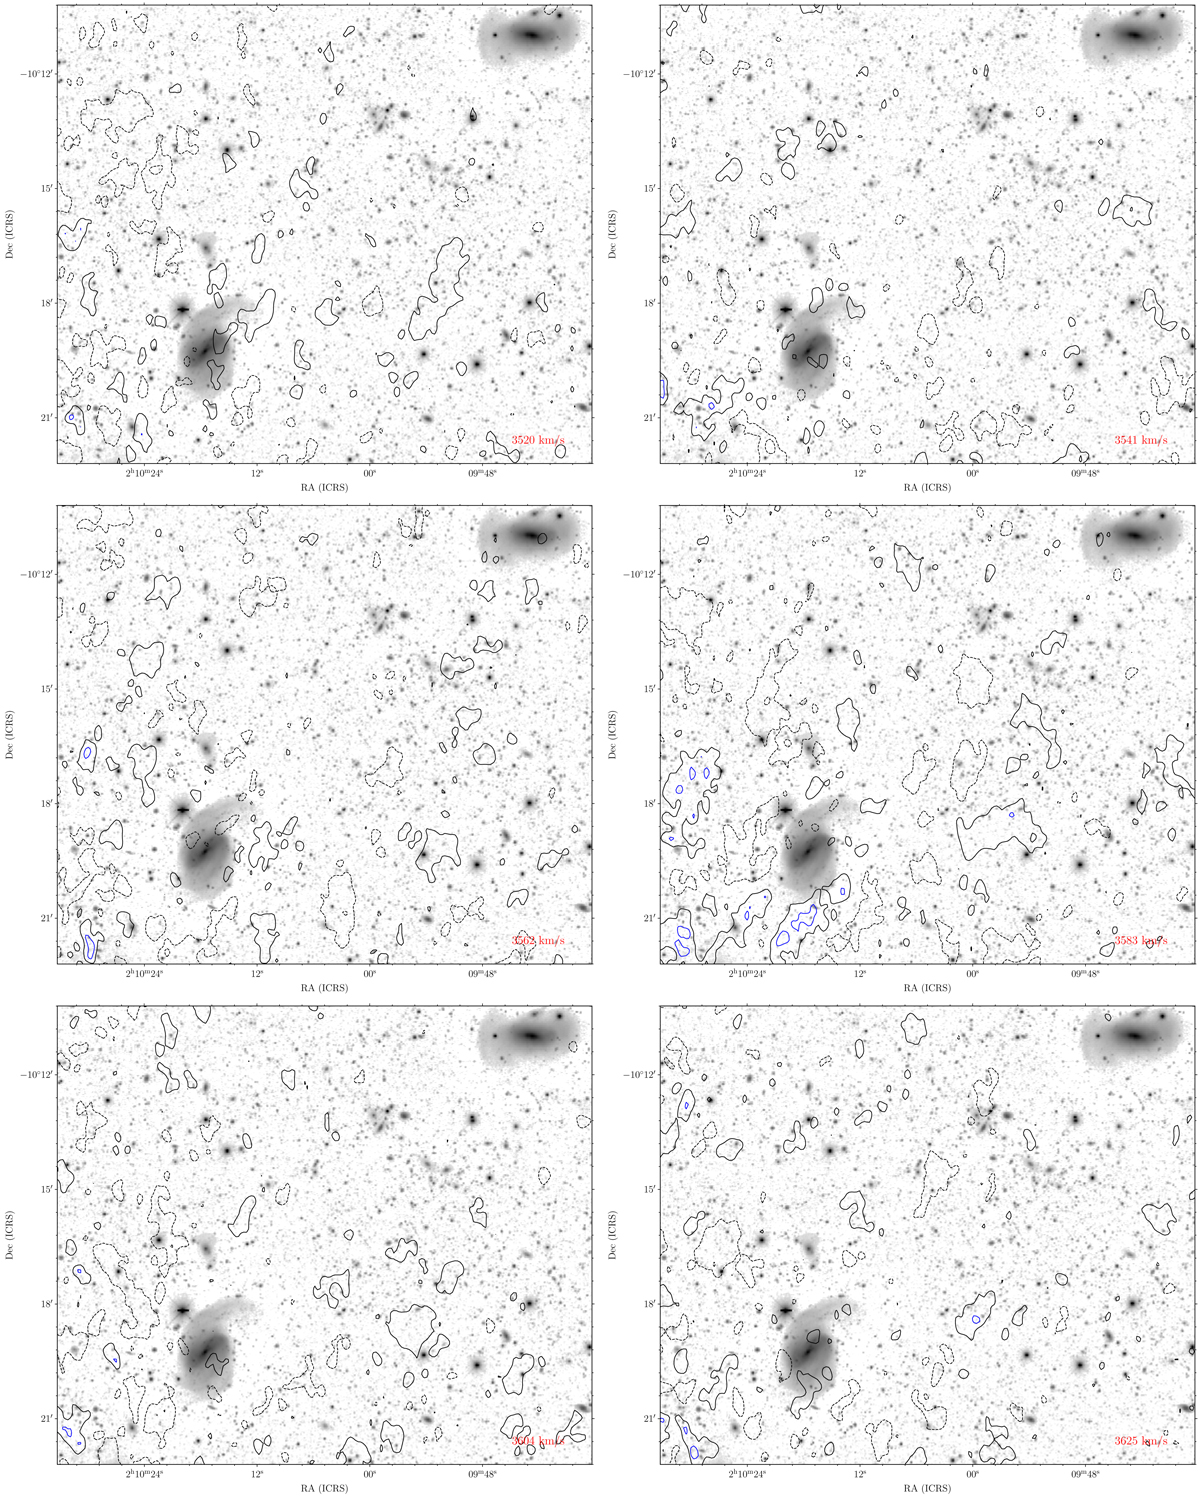
Channel maps showing the H I emission in the SE tail and NGC 848 overlaid on the DECaLS r-band image. Contour levels: −1, 1, 2, 4, 8, 16 × 0.9 mJy per beam, ×1.8 × 1019 cm−2, or ×0.15 M⊙ pc−2. The contours are coloured (in order of increasing flux): black (dashed), black, blue, purple, red, and orange. The noise level rises towards the South East as this it is near the edge of the VLA primary beam.
Current usage metrics show cumulative count of Article Views (full-text article views including HTML views, PDF and ePub downloads, according to the available data) and Abstracts Views on Vision4Press platform.
Data correspond to usage on the plateform after 2015. The current usage metrics is available 48-96 hours after online publication and is updated daily on week days.
Initial download of the metrics may take a while.