Free Access
Fig. 15.
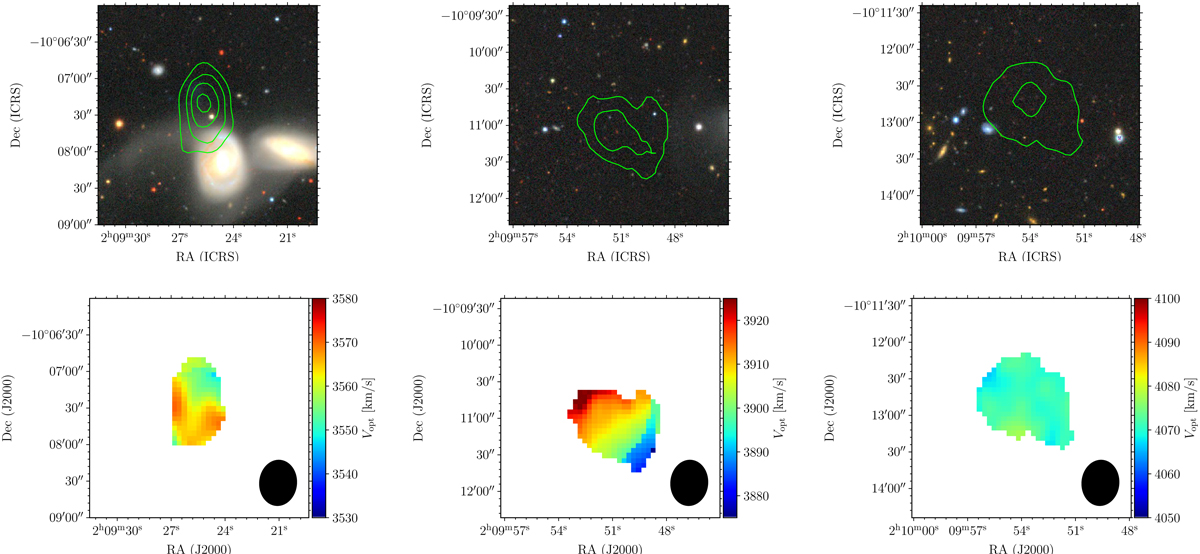
Top: moment-zero maps of the NW, E, and S clumps (left to right) overlaid on the DECaLS grz image. Contour levels: 0.98, 1.47, 1.96, 2.45 × 1020 cm−2. Bottom: first-moment maps of the same features with the beam shown as a black ellipse in the corner.
Current usage metrics show cumulative count of Article Views (full-text article views including HTML views, PDF and ePub downloads, according to the available data) and Abstracts Views on Vision4Press platform.
Data correspond to usage on the plateform after 2015. The current usage metrics is available 48-96 hours after online publication and is updated daily on week days.
Initial download of the metrics may take a while.