Free Access
Fig. 14.
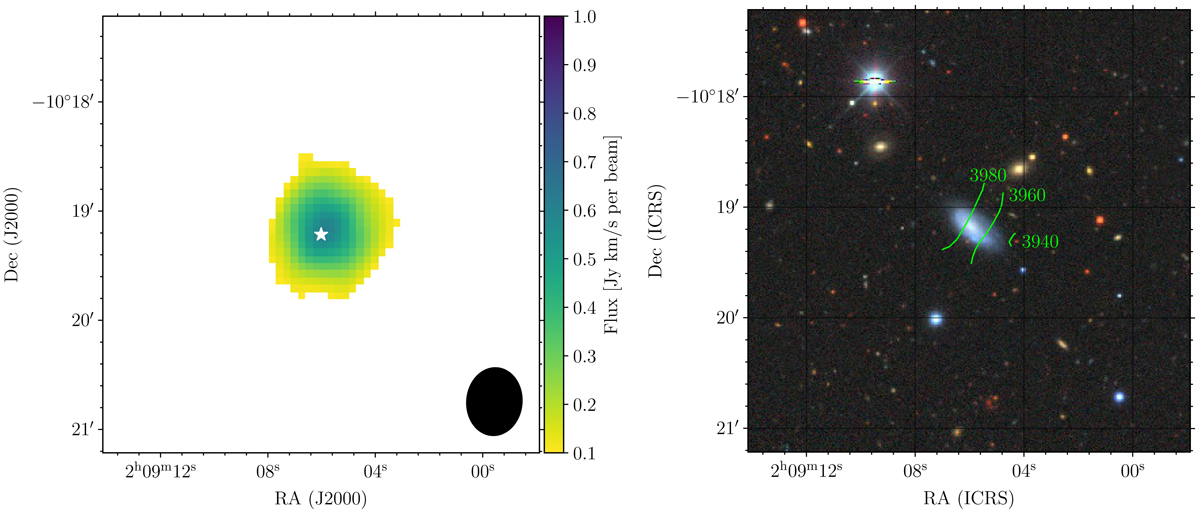
Left: moment-zero map of PGC 8210. The white star indicates the optical centre, and the black ellipse shows the beam. Right: first-moment contours for PGC 8210 overlaid on the DECaLS grz image. The green lines are separated by 20 km s−1.
Current usage metrics show cumulative count of Article Views (full-text article views including HTML views, PDF and ePub downloads, according to the available data) and Abstracts Views on Vision4Press platform.
Data correspond to usage on the plateform after 2015. The current usage metrics is available 48-96 hours after online publication and is updated daily on week days.
Initial download of the metrics may take a while.