Fig. 12.
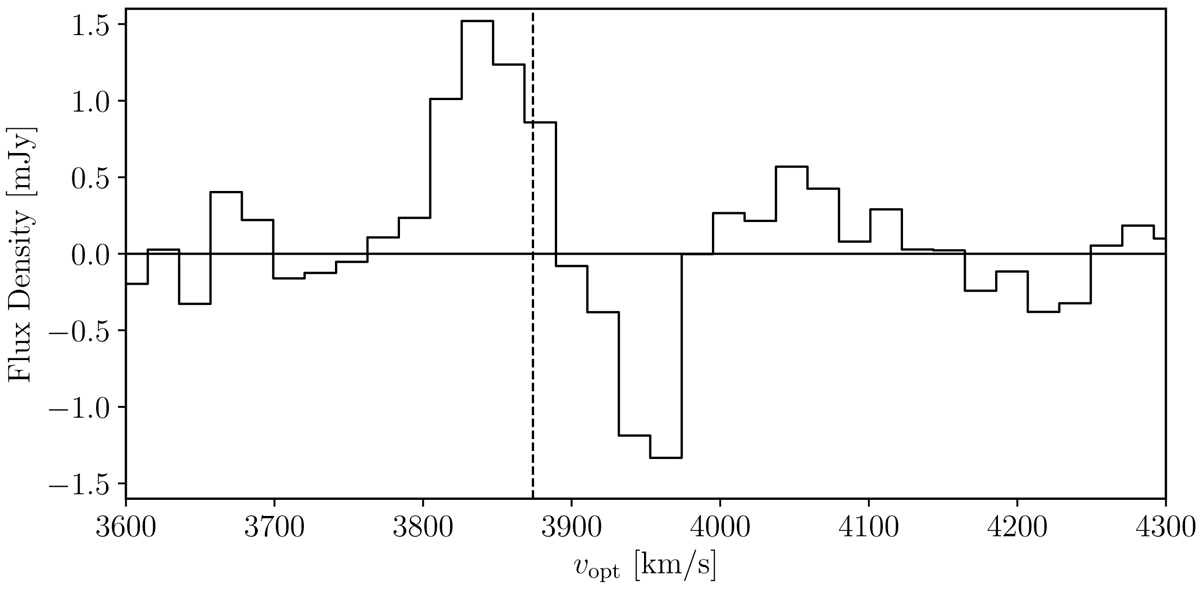
H I spectral profile of the centre of HCG 16d. The dashed vertical line shows the systemic velocity as determined from optical lines. The profile was extracted from the robust = 0 cube (higher resolution) by placing a double Gaussian window at the position of the optical centre of the galaxy with the shape and orientation of the synthesized beam.
Current usage metrics show cumulative count of Article Views (full-text article views including HTML views, PDF and ePub downloads, according to the available data) and Abstracts Views on Vision4Press platform.
Data correspond to usage on the plateform after 2015. The current usage metrics is available 48-96 hours after online publication and is updated daily on week days.
Initial download of the metrics may take a while.