Fig. 11.
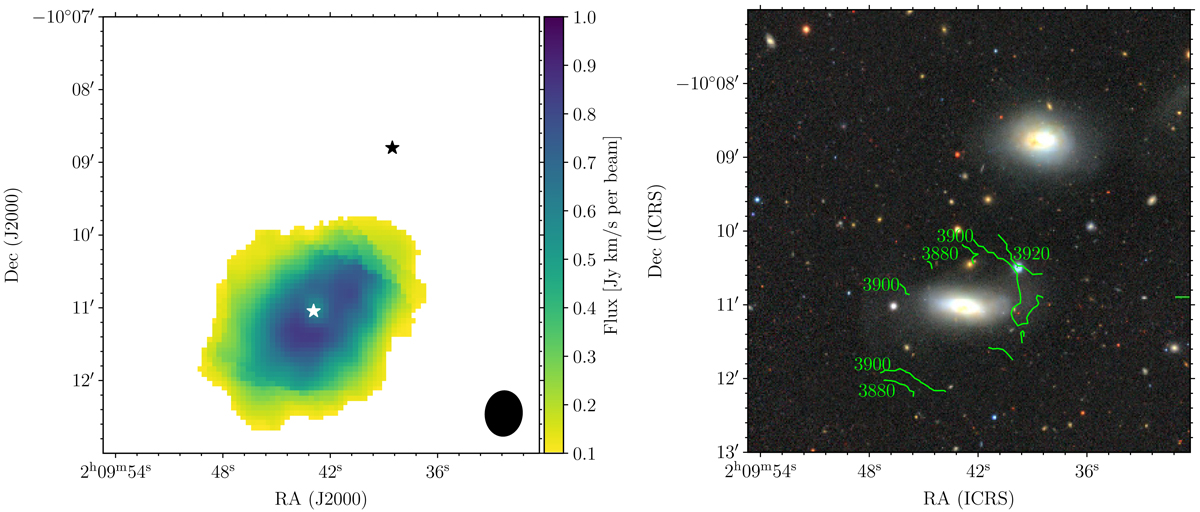
Left: moment-zero map of HCG 16d. The white and black stars indicate the optical centres of HCG 16d and c, respectively, and the black ellipse shows the beam. A central depression is clearly visible around the white star marking the centre of HCG 16d. Right: first-moment contours for HCG 16d overlaid on the DECaLS grz image of HCG 16d and c. The central region of the galaxy is removed as the H I absorption feature would contaminate the first-moment map there. The green lines are separated by 20 km s−1. While the velocity field is highly irregular, there is a slight gradient roughly aligned with the minor axis of the optical disc.
Current usage metrics show cumulative count of Article Views (full-text article views including HTML views, PDF and ePub downloads, according to the available data) and Abstracts Views on Vision4Press platform.
Data correspond to usage on the plateform after 2015. The current usage metrics is available 48-96 hours after online publication and is updated daily on week days.
Initial download of the metrics may take a while.