Fig. 2.
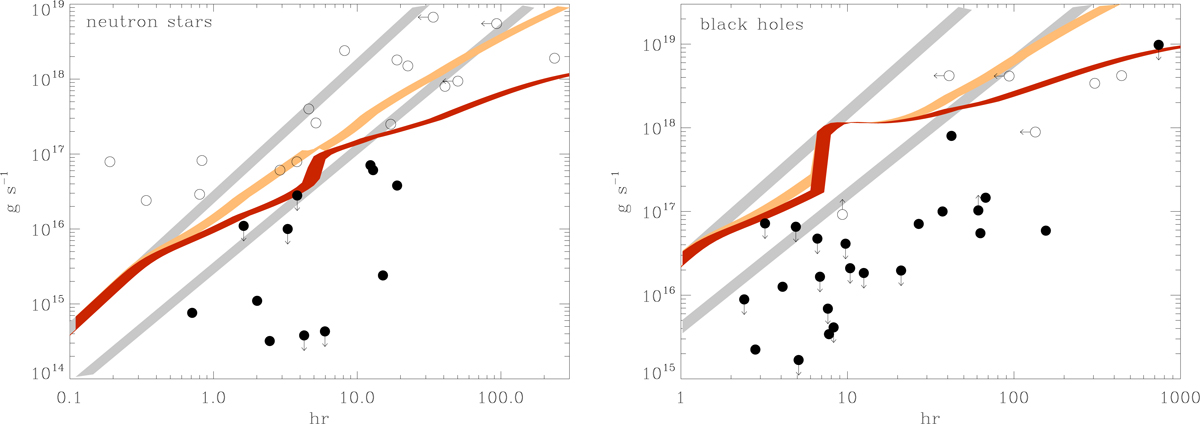
Stability diagram for neutron stars (left panel) and black holes (right panel) in the (Porb, Ṁ) plane. Data points taken from Coriat et al. (2012) and the WATCHDOG catalogue (Tetarenko et al. 2016), with open and filled circles representing stable and unstable systems, respectively. In each panel, the two straight grey lines show the stability limits for the standard unirradiated (top line) and irradiated (bottom line, with 𝒞 = 10−3) discs. The red line shows the stability limit on Ṁin with a thermal wind and a self-consistent determination of 𝒞. The yellow line shows the same but on the mass transfer rate Ṁt = Ṁw + Ṁin. The limits are calculated for a 1.4 M⊙ neutron star and a 10 M⊙ black hole. The thickness of the lines illustrates how the stability criterion changes when the mass ratio of the secondary star to the compact object q changes from 0.1 to 1.
Current usage metrics show cumulative count of Article Views (full-text article views including HTML views, PDF and ePub downloads, according to the available data) and Abstracts Views on Vision4Press platform.
Data correspond to usage on the plateform after 2015. The current usage metrics is available 48-96 hours after online publication and is updated daily on week days.
Initial download of the metrics may take a while.