Fig. 8
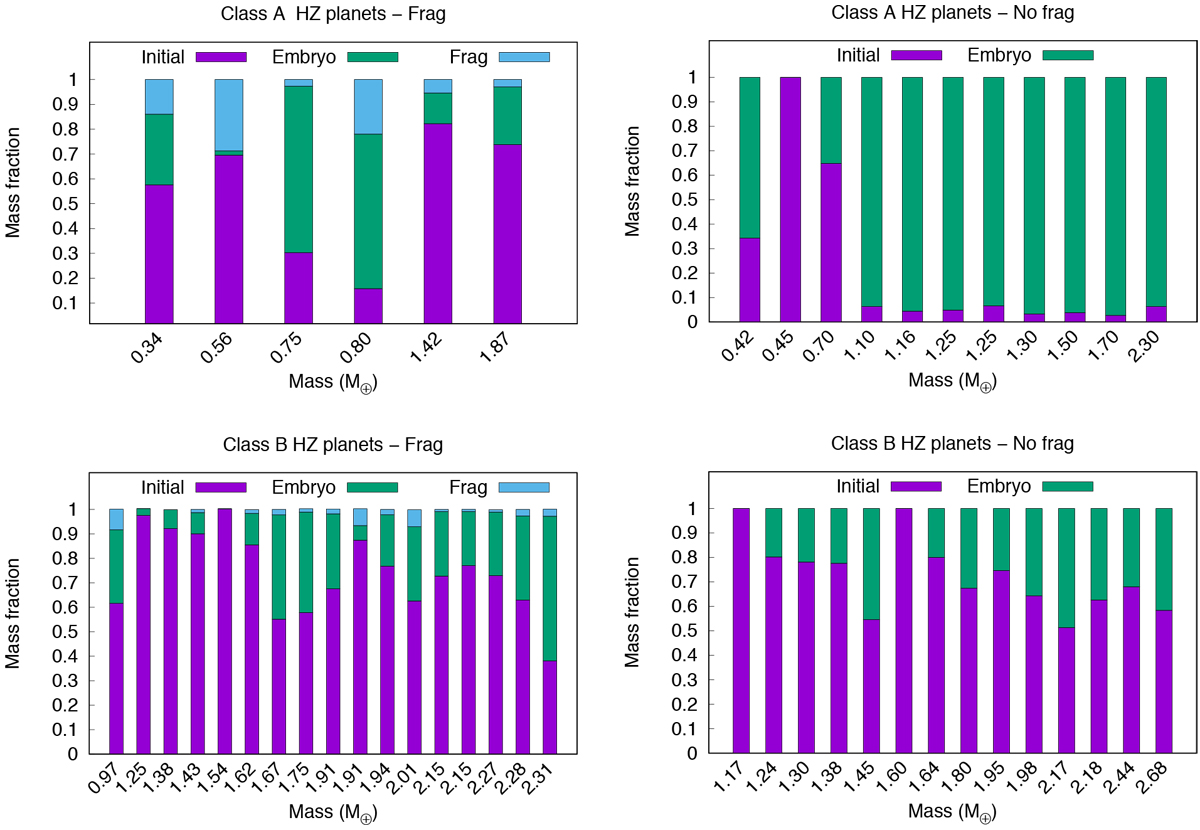
Distribution of the final mass for the surviving planets in the HZ. The violet bars represent the mass fraction corresponding to the initial mass of the body. The green and sky blue bars represent the mass fraction contribution from partial (or total) accretion of embryos and fragments, respectively. Top panels: the results for the class A HZ planets for Frag (left) and No Frag (right) simulations. Bottom panels: top panels but for the class B HZ planets. The height of each bar is normalized to the final mass of each planet.
Current usage metrics show cumulative count of Article Views (full-text article views including HTML views, PDF and ePub downloads, according to the available data) and Abstracts Views on Vision4Press platform.
Data correspond to usage on the plateform after 2015. The current usage metrics is available 48-96 hours after online publication and is updated daily on week days.
Initial download of the metrics may take a while.