Fig. 9.
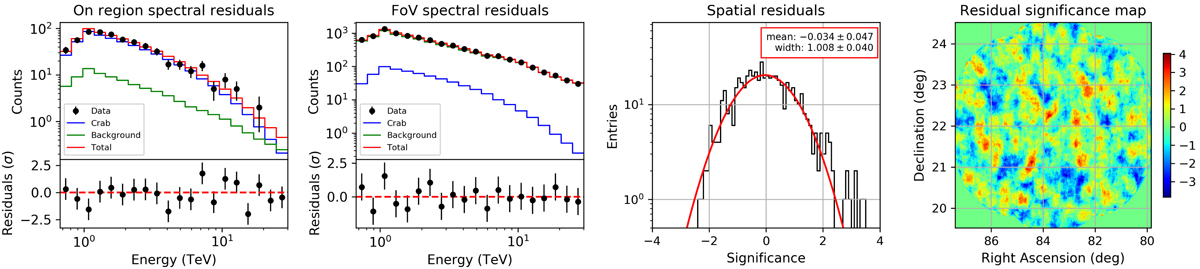
Residuals after fitting the Crab observations using a 2D Gaussian spatial model with an exponentially cut-off power-law spectrum using an unbinned maximum likelihood fit. Leftmost panel: counts and model spectra and the residuals after subtraction of the source and background models for the On region. Second panel: spectra and residuals for the entire field of view. In both panels, red lines represent the total predicted model counts, blue lines the predicted source counts and green lines the predicted background counts. Third panel: histogram of significances, determined after summing over the spectral dimension and by sampling the events into bins of 0.2° ×0.2°. A Gaussian was fitted to the significance histogram, and the best fitting mean and width of the Gaussian are given together with the statistical fit errors in the plots. Perfect residuals would lead to a mean of zero and a width of unity. Rightmost panel: residual significance map summed over all energies for a correlation radius of 0.2°. The map is in significance units expressed in Gaussian σ.
Current usage metrics show cumulative count of Article Views (full-text article views including HTML views, PDF and ePub downloads, according to the available data) and Abstracts Views on Vision4Press platform.
Data correspond to usage on the plateform after 2015. The current usage metrics is available 48-96 hours after online publication and is updated daily on week days.
Initial download of the metrics may take a while.