Fig. 8.
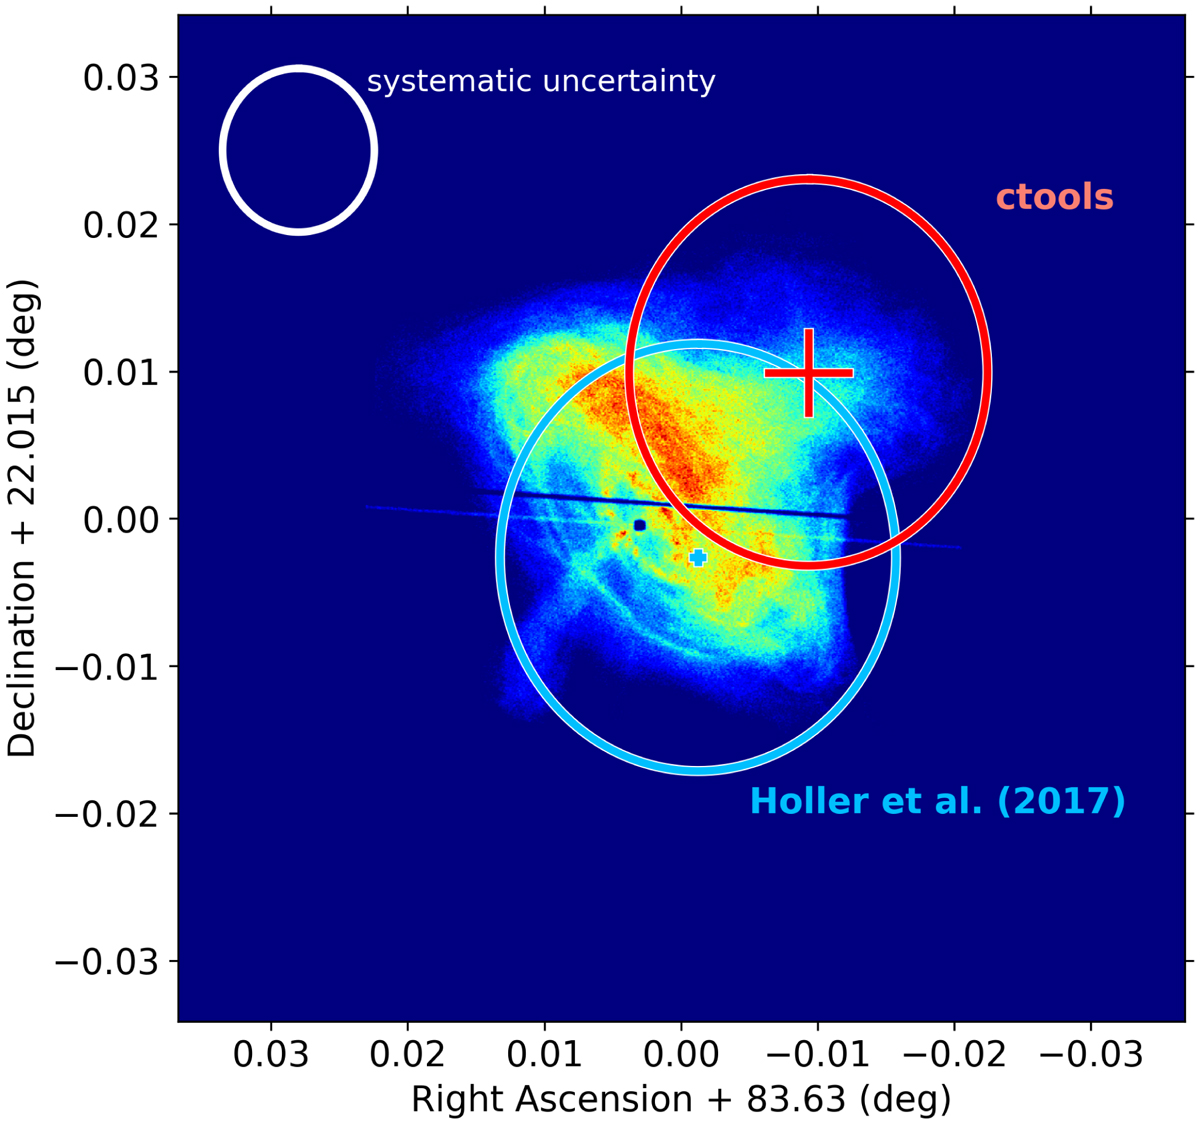
Gamma-ray extension, given as the 1σ radius of a 2D Gaussian fit, of the Crab nebula as derived from Holler et al. (2017) (blue) and using ctools (red) superimposed on a Chandra 0.3–10 keV X-ray image of the Crab nebula (credit: NASA/CXC/SAO). The crosses indicate the statistical uncertainty in the centroid position as quoted by Holler et al. (2017) (blue) and as derived from the Gaussian model fitting using ctlike (red). The systematic positioning accuracy of H.E.S.S. of 20″ (Holler et al. 2017) is indicated as a white circle. Coordinates are for the epoch J2000.
Current usage metrics show cumulative count of Article Views (full-text article views including HTML views, PDF and ePub downloads, according to the available data) and Abstracts Views on Vision4Press platform.
Data correspond to usage on the plateform after 2015. The current usage metrics is available 48-96 hours after online publication and is updated daily on week days.
Initial download of the metrics may take a while.